Yuman vs Immigrants from France Median Male Earnings
COMPARE
Yuman
Immigrants from France
Median Male Earnings
Median Male Earnings Comparison
Yuman
Immigrants from France
$45,446
MEDIAN MALE EARNINGS
0.0/ 100
METRIC RATING
325th/ 347
METRIC RANK
$63,715
MEDIAN MALE EARNINGS
100.0/ 100
METRIC RATING
30th/ 347
METRIC RANK
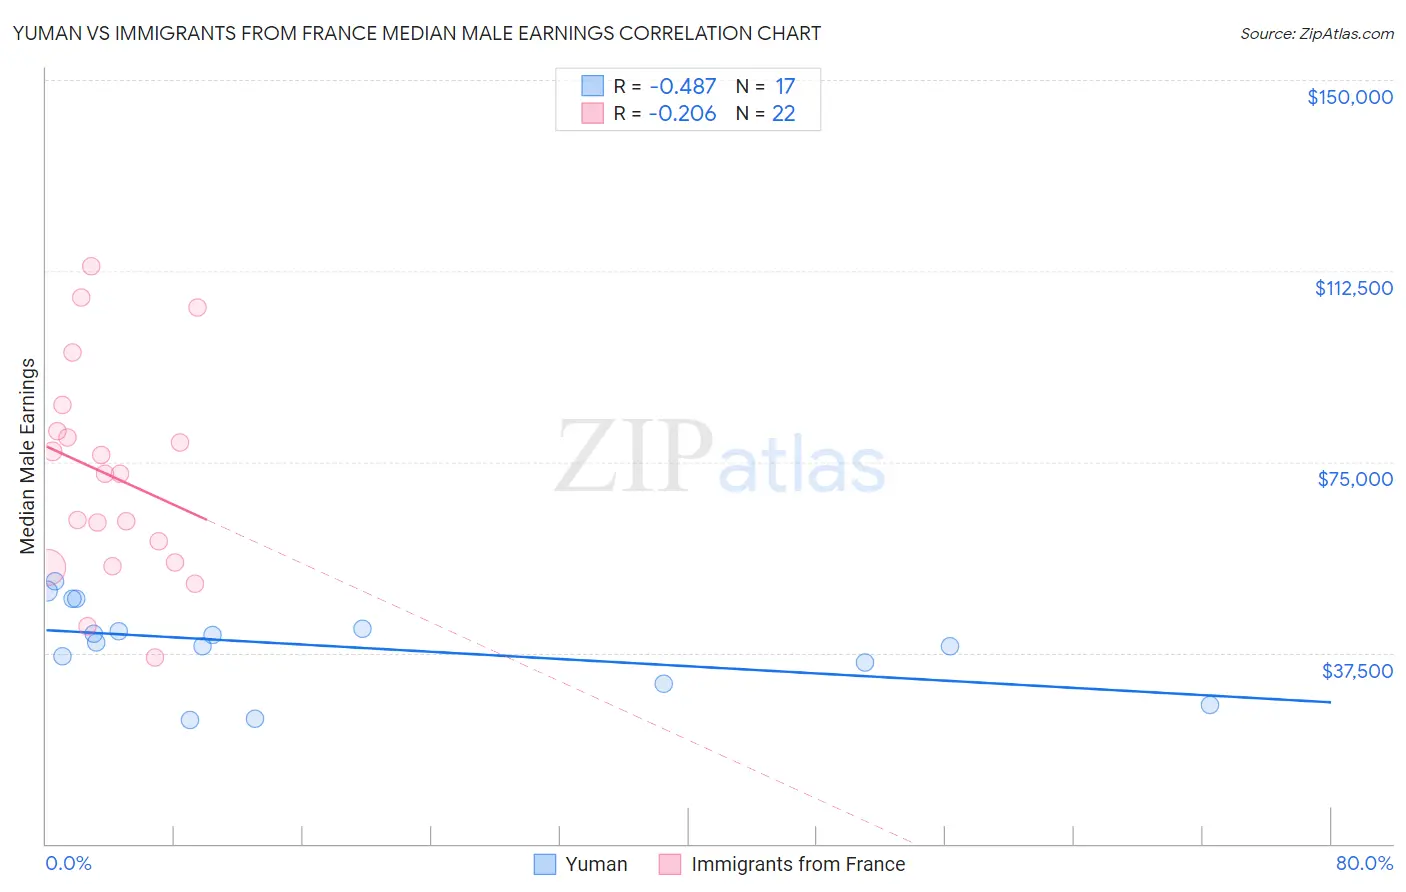
Yuman vs Immigrants from France Median Male Earnings Correlation Chart
The statistical analysis conducted on geographies consisting of 40,680,371 people shows a moderate negative correlation between the proportion of Yuman and median male earnings in the United States with a correlation coefficient (R) of -0.487 and weighted average of $45,446. Similarly, the statistical analysis conducted on geographies consisting of 287,844,357 people shows a weak negative correlation between the proportion of Immigrants from France and median male earnings in the United States with a correlation coefficient (R) of -0.206 and weighted average of $63,715, a difference of 40.2%.
Median Male Earnings Correlation Summary
| Measurement | Yuman | Immigrants from France |
| Minimum | $24,301 | $36,667 |
| Maximum | $51,445 | $113,322 |
| Range | $27,144 | $76,655 |
| Mean | $38,868 | $72,320 |
| Median | $39,436 | $72,692 |
| Interquartile 25% (IQ1) | $33,507 | $55,273 |
| Interquartile 75% (IQ3) | $45,172 | $81,126 |
| Interquartile Range (IQR) | $11,665 | $25,853 |
| Standard Deviation (Sample) | $8,269 | $20,619 |
| Standard Deviation (Population) | $8,022 | $20,145 |
Similar Demographics by Median Male Earnings
Demographics Similar to Yuman by Median Male Earnings
In terms of median male earnings, the demographic groups most similar to Yuman are Black/African American ($45,523, a difference of 0.17%), Immigrants from Central America ($45,538, a difference of 0.20%), Sioux ($45,566, a difference of 0.26%), Fijian ($45,607, a difference of 0.35%), and Immigrants from Haiti ($45,266, a difference of 0.40%).
| Demographics | Rating | Rank | Median Male Earnings |
| Cheyenne | 0.0 /100 | #318 | Tragic $46,062 |
| Haitians | 0.0 /100 | #319 | Tragic $45,903 |
| Immigrants | Honduras | 0.0 /100 | #320 | Tragic $45,787 |
| Fijians | 0.0 /100 | #321 | Tragic $45,607 |
| Sioux | 0.0 /100 | #322 | Tragic $45,566 |
| Immigrants | Central America | 0.0 /100 | #323 | Tragic $45,538 |
| Blacks/African Americans | 0.0 /100 | #324 | Tragic $45,523 |
| Yuman | 0.0 /100 | #325 | Tragic $45,446 |
| Immigrants | Haiti | 0.0 /100 | #326 | Tragic $45,266 |
| Immigrants | Bahamas | 0.0 /100 | #327 | Tragic $45,176 |
| Kiowa | 0.0 /100 | #328 | Tragic $45,094 |
| Yakama | 0.0 /100 | #329 | Tragic $45,002 |
| Immigrants | Mexico | 0.0 /100 | #330 | Tragic $44,960 |
| Natives/Alaskans | 0.0 /100 | #331 | Tragic $44,775 |
| Bahamians | 0.0 /100 | #332 | Tragic $44,756 |
Demographics Similar to Immigrants from France by Median Male Earnings
In terms of median male earnings, the demographic groups most similar to Immigrants from France are Asian ($63,827, a difference of 0.18%), Latvian ($63,498, a difference of 0.34%), Russian ($63,939, a difference of 0.35%), Immigrants from Switzerland ($63,944, a difference of 0.36%), and Soviet Union ($63,382, a difference of 0.53%).
| Demographics | Rating | Rank | Median Male Earnings |
| Immigrants | Korea | 100.0 /100 | #23 | Exceptional $65,079 |
| Immigrants | Northern Europe | 100.0 /100 | #24 | Exceptional $64,987 |
| Immigrants | Denmark | 100.0 /100 | #25 | Exceptional $64,625 |
| Turks | 100.0 /100 | #26 | Exceptional $64,253 |
| Immigrants | Switzerland | 100.0 /100 | #27 | Exceptional $63,944 |
| Russians | 100.0 /100 | #28 | Exceptional $63,939 |
| Asians | 100.0 /100 | #29 | Exceptional $63,827 |
| Immigrants | France | 100.0 /100 | #30 | Exceptional $63,715 |
| Latvians | 100.0 /100 | #31 | Exceptional $63,498 |
| Soviet Union | 100.0 /100 | #32 | Exceptional $63,382 |
| Immigrants | Lithuania | 100.0 /100 | #33 | Exceptional $63,346 |
| Immigrants | Russia | 100.0 /100 | #34 | Exceptional $63,326 |
| Immigrants | Asia | 100.0 /100 | #35 | Exceptional $63,240 |
| Israelis | 100.0 /100 | #36 | Exceptional $63,228 |
| Immigrants | Sri Lanka | 100.0 /100 | #37 | Exceptional $63,099 |