Yuman vs Immigrants from China Median Male Earnings
COMPARE
Yuman
Immigrants from China
Median Male Earnings
Median Male Earnings Comparison
Yuman
Immigrants from China
$45,446
MEDIAN MALE EARNINGS
0.0/ 100
METRIC RATING
325th/ 347
METRIC RANK
$67,353
MEDIAN MALE EARNINGS
100.0/ 100
METRIC RATING
13th/ 347
METRIC RANK
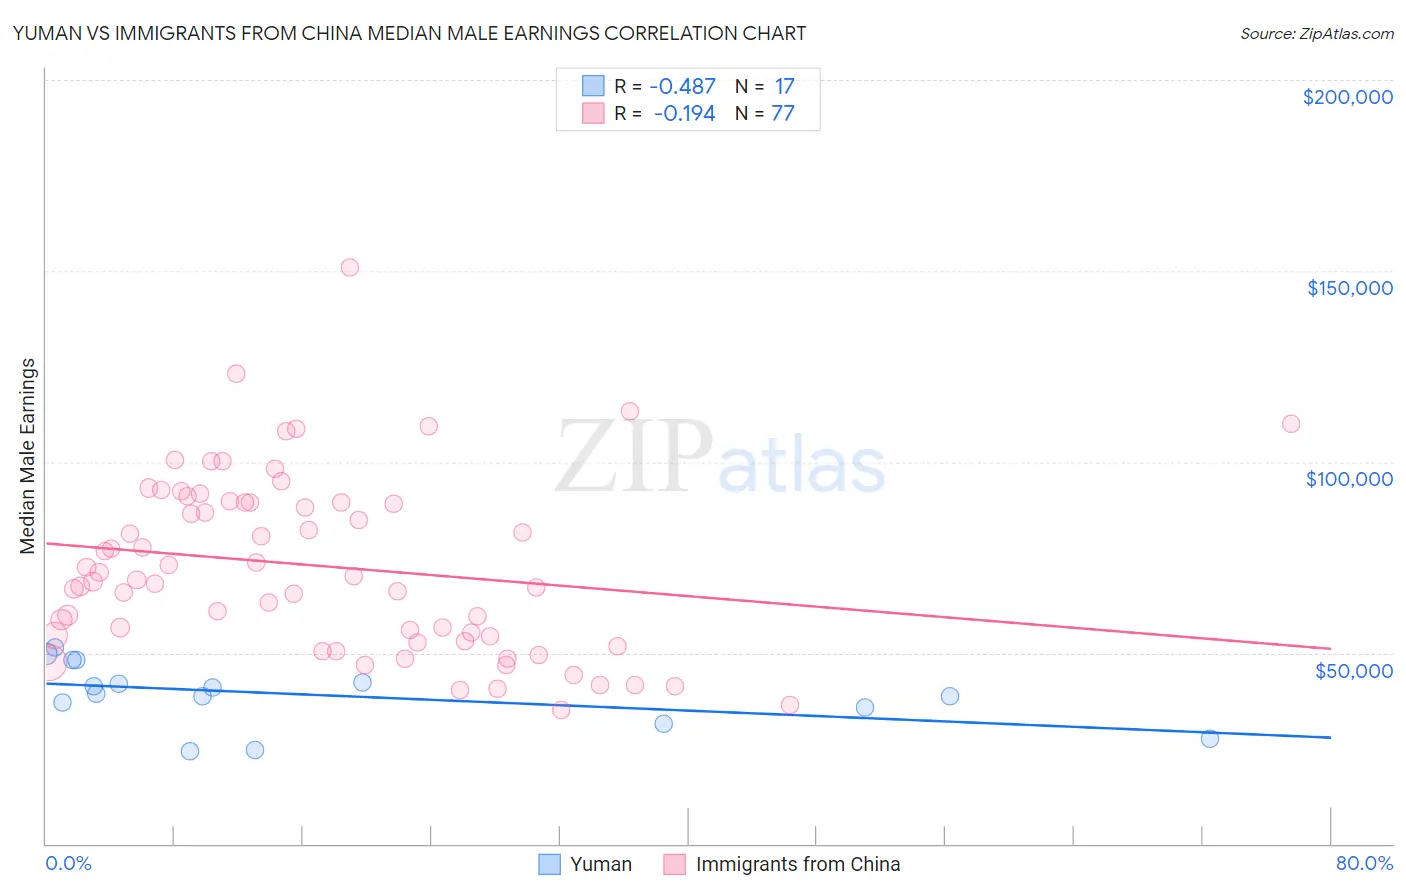
Yuman vs Immigrants from China Median Male Earnings Correlation Chart
The statistical analysis conducted on geographies consisting of 40,680,371 people shows a moderate negative correlation between the proportion of Yuman and median male earnings in the United States with a correlation coefficient (R) of -0.487 and weighted average of $45,446. Similarly, the statistical analysis conducted on geographies consisting of 456,906,248 people shows a poor negative correlation between the proportion of Immigrants from China and median male earnings in the United States with a correlation coefficient (R) of -0.194 and weighted average of $67,353, a difference of 48.2%.
Median Male Earnings Correlation Summary
| Measurement | Yuman | Immigrants from China |
| Minimum | $24,301 | $35,000 |
| Maximum | $51,445 | $150,740 |
| Range | $27,144 | $115,740 |
| Mean | $38,868 | $72,671 |
| Median | $39,436 | $69,216 |
| Interquartile 25% (IQ1) | $33,507 | $53,825 |
| Interquartile 75% (IQ3) | $45,172 | $89,334 |
| Interquartile Range (IQR) | $11,665 | $35,509 |
| Standard Deviation (Sample) | $8,269 | $23,135 |
| Standard Deviation (Population) | $8,022 | $22,985 |
Similar Demographics by Median Male Earnings
Demographics Similar to Yuman by Median Male Earnings
In terms of median male earnings, the demographic groups most similar to Yuman are Black/African American ($45,523, a difference of 0.17%), Immigrants from Central America ($45,538, a difference of 0.20%), Sioux ($45,566, a difference of 0.26%), Fijian ($45,607, a difference of 0.35%), and Immigrants from Haiti ($45,266, a difference of 0.40%).
| Demographics | Rating | Rank | Median Male Earnings |
| Cheyenne | 0.0 /100 | #318 | Tragic $46,062 |
| Haitians | 0.0 /100 | #319 | Tragic $45,903 |
| Immigrants | Honduras | 0.0 /100 | #320 | Tragic $45,787 |
| Fijians | 0.0 /100 | #321 | Tragic $45,607 |
| Sioux | 0.0 /100 | #322 | Tragic $45,566 |
| Immigrants | Central America | 0.0 /100 | #323 | Tragic $45,538 |
| Blacks/African Americans | 0.0 /100 | #324 | Tragic $45,523 |
| Yuman | 0.0 /100 | #325 | Tragic $45,446 |
| Immigrants | Haiti | 0.0 /100 | #326 | Tragic $45,266 |
| Immigrants | Bahamas | 0.0 /100 | #327 | Tragic $45,176 |
| Kiowa | 0.0 /100 | #328 | Tragic $45,094 |
| Yakama | 0.0 /100 | #329 | Tragic $45,002 |
| Immigrants | Mexico | 0.0 /100 | #330 | Tragic $44,960 |
| Natives/Alaskans | 0.0 /100 | #331 | Tragic $44,775 |
| Bahamians | 0.0 /100 | #332 | Tragic $44,756 |
Demographics Similar to Immigrants from China by Median Male Earnings
In terms of median male earnings, the demographic groups most similar to Immigrants from China are Okinawan ($67,232, a difference of 0.18%), Immigrants from Australia ($67,634, a difference of 0.42%), Immigrants from Ireland ($67,698, a difference of 0.51%), Immigrants from Eastern Asia ($66,903, a difference of 0.67%), and Eastern European ($66,472, a difference of 1.3%).
| Demographics | Rating | Rank | Median Male Earnings |
| Iranians | 100.0 /100 | #6 | Exceptional $70,648 |
| Immigrants | Hong Kong | 100.0 /100 | #7 | Exceptional $70,146 |
| Immigrants | Iran | 100.0 /100 | #8 | Exceptional $69,284 |
| Immigrants | South Central Asia | 100.0 /100 | #9 | Exceptional $68,960 |
| Immigrants | Israel | 100.0 /100 | #10 | Exceptional $68,716 |
| Immigrants | Ireland | 100.0 /100 | #11 | Exceptional $67,698 |
| Immigrants | Australia | 100.0 /100 | #12 | Exceptional $67,634 |
| Immigrants | China | 100.0 /100 | #13 | Exceptional $67,353 |
| Okinawans | 100.0 /100 | #14 | Exceptional $67,232 |
| Immigrants | Eastern Asia | 100.0 /100 | #15 | Exceptional $66,903 |
| Eastern Europeans | 100.0 /100 | #16 | Exceptional $66,472 |
| Immigrants | Belgium | 100.0 /100 | #17 | Exceptional $66,125 |
| Indians (Asian) | 100.0 /100 | #18 | Exceptional $66,078 |
| Cypriots | 100.0 /100 | #19 | Exceptional $65,549 |
| Immigrants | Japan | 100.0 /100 | #20 | Exceptional $65,518 |