Yuman vs Venezuelan Female Poverty Among 18-24 Year Olds
COMPARE
Yuman
Venezuelan
Female Poverty Among 18-24 Year Olds
Female Poverty Among 18-24 Year Olds Comparison
Yuman
Venezuelans
24.0%
FEMALE POVERTY AMONG 18-24 YEAR OLDS
0.0/ 100
METRIC RATING
312th/ 347
METRIC RANK
17.7%
FEMALE POVERTY AMONG 18-24 YEAR OLDS
100.0/ 100
METRIC RATING
28th/ 347
METRIC RANK
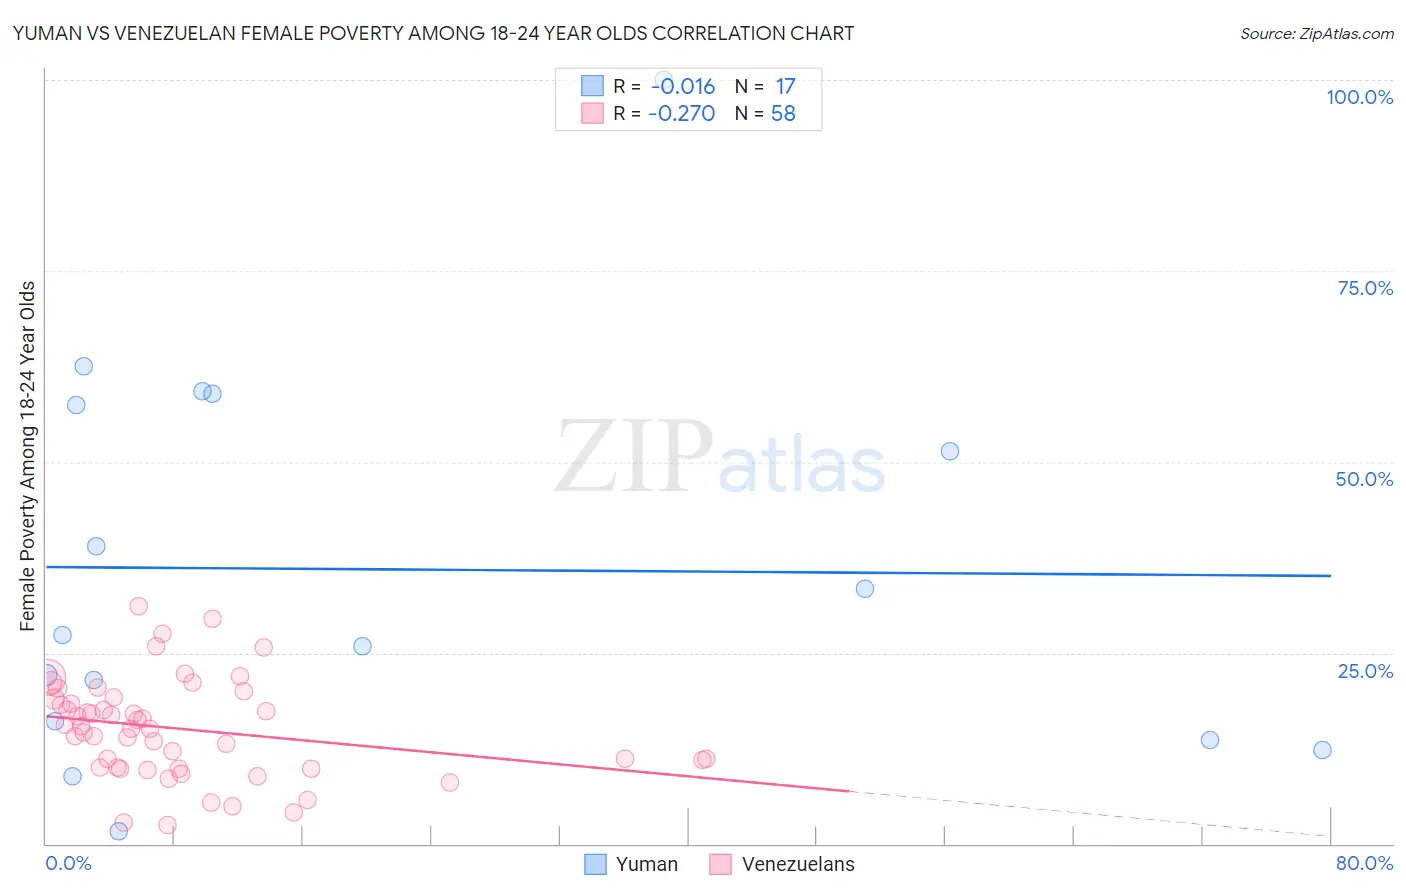
Yuman vs Venezuelan Female Poverty Among 18-24 Year Olds Correlation Chart
The statistical analysis conducted on geographies consisting of 40,585,448 people shows no correlation between the proportion of Yuman and poverty level among females between the ages 18 and 24 in the United States with a correlation coefficient (R) of -0.016 and weighted average of 24.0%. Similarly, the statistical analysis conducted on geographies consisting of 301,336,833 people shows a weak negative correlation between the proportion of Venezuelans and poverty level among females between the ages 18 and 24 in the United States with a correlation coefficient (R) of -0.270 and weighted average of 17.7%, a difference of 35.4%.
Female Poverty Among 18-24 Year Olds Correlation Summary
| Measurement | Yuman | Venezuelan |
| Minimum | 1.7% | 2.4% |
| Maximum | 100.0% | 31.1% |
| Range | 98.3% | 28.7% |
| Mean | 35.9% | 15.1% |
| Median | 27.4% | 15.3% |
| Interquartile 25% (IQ1) | 14.9% | 9.9% |
| Interquartile 75% (IQ3) | 58.2% | 18.9% |
| Interquartile Range (IQR) | 43.3% | 9.0% |
| Standard Deviation (Sample) | 25.7% | 6.4% |
| Standard Deviation (Population) | 24.9% | 6.4% |
Similar Demographics by Female Poverty Among 18-24 Year Olds
Demographics Similar to Yuman by Female Poverty Among 18-24 Year Olds
In terms of female poverty among 18-24 year olds, the demographic groups most similar to Yuman are Creek (24.2%, a difference of 1.1%), Potawatomi (23.7%, a difference of 1.2%), Choctaw (24.3%, a difference of 1.2%), Black/African American (24.3%, a difference of 1.4%), and Comanche (23.6%, a difference of 1.5%).
| Demographics | Rating | Rank | Female Poverty Among 18-24 Year Olds |
| Immigrants | Kuwait | 0.0 /100 | #305 | Tragic 23.0% |
| Paiute | 0.0 /100 | #306 | Tragic 23.3% |
| Cree | 0.0 /100 | #307 | Tragic 23.4% |
| Immigrants | Sudan | 0.0 /100 | #308 | Tragic 23.5% |
| Blackfeet | 0.0 /100 | #309 | Tragic 23.6% |
| Comanche | 0.0 /100 | #310 | Tragic 23.6% |
| Potawatomi | 0.0 /100 | #311 | Tragic 23.7% |
| Yuman | 0.0 /100 | #312 | Tragic 24.0% |
| Creek | 0.0 /100 | #313 | Tragic 24.2% |
| Choctaw | 0.0 /100 | #314 | Tragic 24.3% |
| Blacks/African Americans | 0.0 /100 | #315 | Tragic 24.3% |
| Alsatians | 0.0 /100 | #316 | Tragic 24.4% |
| Osage | 0.0 /100 | #317 | Tragic 24.5% |
| Chickasaw | 0.0 /100 | #318 | Tragic 24.5% |
| Dutch West Indians | 0.0 /100 | #319 | Tragic 24.5% |
Demographics Similar to Venezuelans by Female Poverty Among 18-24 Year Olds
In terms of female poverty among 18-24 year olds, the demographic groups most similar to Venezuelans are Colombian (17.7%, a difference of 0.14%), Immigrants from Fiji (17.7%, a difference of 0.24%), Portuguese (17.8%, a difference of 0.33%), Immigrants from South Eastern Asia (17.8%, a difference of 0.50%), and Immigrants from South Central Asia (17.6%, a difference of 0.57%).
| Demographics | Rating | Rank | Female Poverty Among 18-24 Year Olds |
| Bolivians | 100.0 /100 | #21 | Exceptional 17.4% |
| Immigrants | Hong Kong | 100.0 /100 | #22 | Exceptional 17.5% |
| Immigrants | North Macedonia | 100.0 /100 | #23 | Exceptional 17.6% |
| Maltese | 100.0 /100 | #24 | Exceptional 17.6% |
| Immigrants | South Central Asia | 100.0 /100 | #25 | Exceptional 17.6% |
| Immigrants | Fiji | 100.0 /100 | #26 | Exceptional 17.7% |
| Colombians | 100.0 /100 | #27 | Exceptional 17.7% |
| Venezuelans | 100.0 /100 | #28 | Exceptional 17.7% |
| Portuguese | 100.0 /100 | #29 | Exceptional 17.8% |
| Immigrants | South Eastern Asia | 100.0 /100 | #30 | Exceptional 17.8% |
| Immigrants | Vietnam | 100.0 /100 | #31 | Exceptional 17.8% |
| Immigrants | Moldova | 100.0 /100 | #32 | Exceptional 17.9% |
| Native Hawaiians | 100.0 /100 | #33 | Exceptional 17.9% |
| Immigrants | Nicaragua | 100.0 /100 | #34 | Exceptional 17.9% |
| Immigrants | Greece | 100.0 /100 | #35 | Exceptional 17.9% |