Yuman vs Immigrants from Armenia Median Male Earnings
COMPARE
Yuman
Immigrants from Armenia
Median Male Earnings
Median Male Earnings Comparison
Yuman
Immigrants from Armenia
$45,446
MEDIAN MALE EARNINGS
0.0/ 100
METRIC RATING
325th/ 347
METRIC RANK
$51,793
MEDIAN MALE EARNINGS
6.6/ 100
METRIC RATING
220th/ 347
METRIC RANK
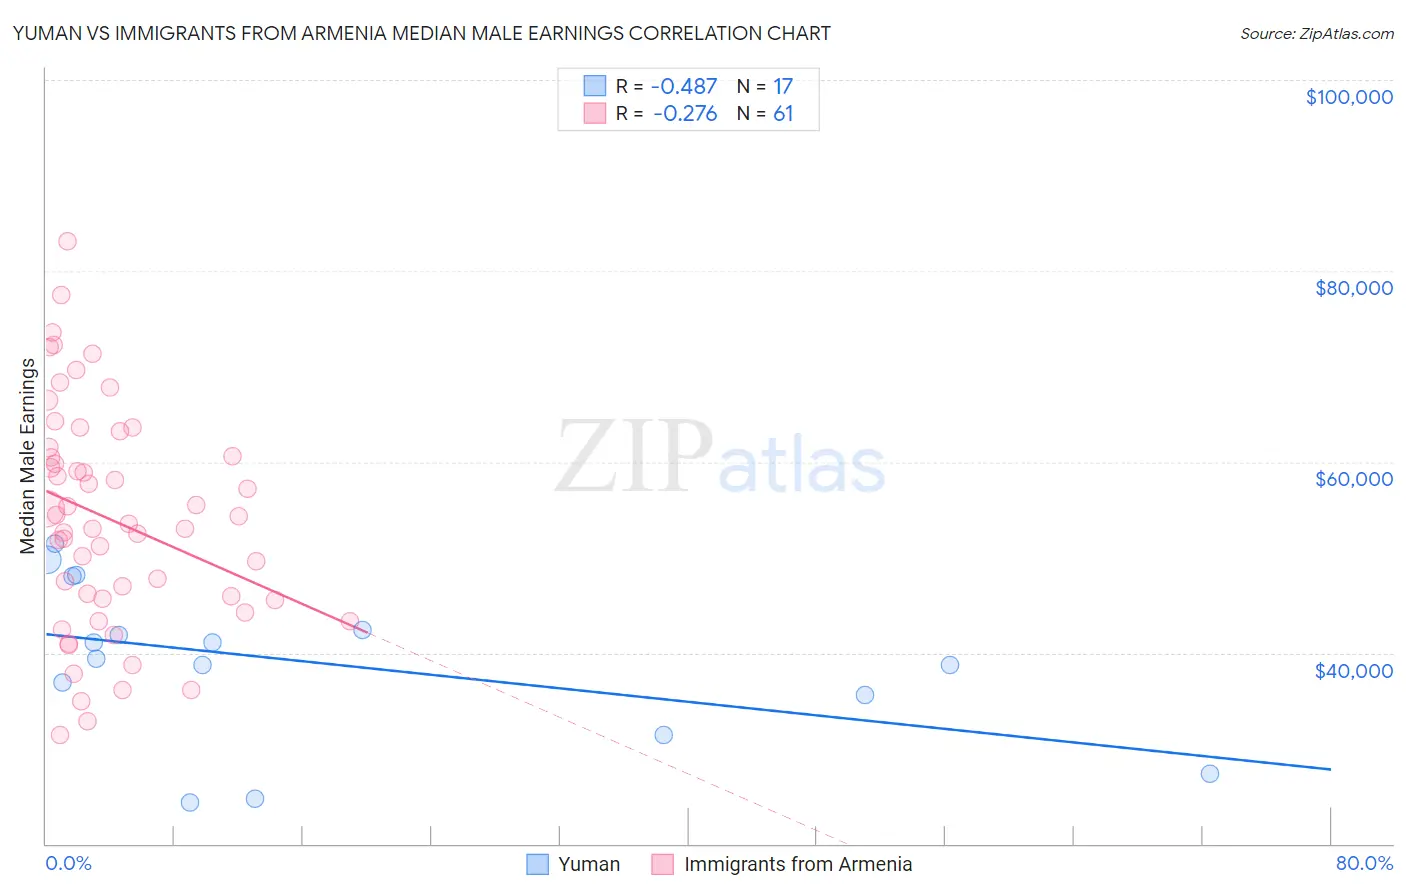
Yuman vs Immigrants from Armenia Median Male Earnings Correlation Chart
The statistical analysis conducted on geographies consisting of 40,680,371 people shows a moderate negative correlation between the proportion of Yuman and median male earnings in the United States with a correlation coefficient (R) of -0.487 and weighted average of $45,446. Similarly, the statistical analysis conducted on geographies consisting of 97,713,127 people shows a weak negative correlation between the proportion of Immigrants from Armenia and median male earnings in the United States with a correlation coefficient (R) of -0.276 and weighted average of $51,793, a difference of 14.0%.
Median Male Earnings Correlation Summary
| Measurement | Yuman | Immigrants from Armenia |
| Minimum | $24,301 | $31,379 |
| Maximum | $51,445 | $83,085 |
| Range | $27,144 | $51,706 |
| Mean | $38,868 | $53,967 |
| Median | $39,436 | $53,459 |
| Interquartile 25% (IQ1) | $33,507 | $45,624 |
| Interquartile 75% (IQ3) | $45,172 | $61,019 |
| Interquartile Range (IQR) | $11,665 | $15,395 |
| Standard Deviation (Sample) | $8,269 | $11,610 |
| Standard Deviation (Population) | $8,022 | $11,514 |
Similar Demographics by Median Male Earnings
Demographics Similar to Yuman by Median Male Earnings
In terms of median male earnings, the demographic groups most similar to Yuman are Black/African American ($45,523, a difference of 0.17%), Immigrants from Central America ($45,538, a difference of 0.20%), Sioux ($45,566, a difference of 0.26%), Fijian ($45,607, a difference of 0.35%), and Immigrants from Haiti ($45,266, a difference of 0.40%).
| Demographics | Rating | Rank | Median Male Earnings |
| Cheyenne | 0.0 /100 | #318 | Tragic $46,062 |
| Haitians | 0.0 /100 | #319 | Tragic $45,903 |
| Immigrants | Honduras | 0.0 /100 | #320 | Tragic $45,787 |
| Fijians | 0.0 /100 | #321 | Tragic $45,607 |
| Sioux | 0.0 /100 | #322 | Tragic $45,566 |
| Immigrants | Central America | 0.0 /100 | #323 | Tragic $45,538 |
| Blacks/African Americans | 0.0 /100 | #324 | Tragic $45,523 |
| Yuman | 0.0 /100 | #325 | Tragic $45,446 |
| Immigrants | Haiti | 0.0 /100 | #326 | Tragic $45,266 |
| Immigrants | Bahamas | 0.0 /100 | #327 | Tragic $45,176 |
| Kiowa | 0.0 /100 | #328 | Tragic $45,094 |
| Yakama | 0.0 /100 | #329 | Tragic $45,002 |
| Immigrants | Mexico | 0.0 /100 | #330 | Tragic $44,960 |
| Natives/Alaskans | 0.0 /100 | #331 | Tragic $44,775 |
| Bahamians | 0.0 /100 | #332 | Tragic $44,756 |
Demographics Similar to Immigrants from Armenia by Median Male Earnings
In terms of median male earnings, the demographic groups most similar to Immigrants from Armenia are Immigrants from Ghana ($51,836, a difference of 0.080%), Immigrants from Senegal ($51,647, a difference of 0.28%), Immigrants from Bangladesh ($51,642, a difference of 0.29%), Immigrants from Panama ($51,962, a difference of 0.33%), and Ecuadorian ($51,596, a difference of 0.38%).
| Demographics | Rating | Rank | Median Male Earnings |
| Native Hawaiians | 10.5 /100 | #213 | Poor $52,306 |
| Immigrants | Nonimmigrants | 9.3 /100 | #214 | Tragic $52,170 |
| Immigrants | Cameroon | 8.9 /100 | #215 | Tragic $52,119 |
| Immigrants | Venezuela | 8.3 /100 | #216 | Tragic $52,041 |
| Nigerians | 8.3 /100 | #217 | Tragic $52,039 |
| Immigrants | Panama | 7.7 /100 | #218 | Tragic $51,962 |
| Immigrants | Ghana | 6.9 /100 | #219 | Tragic $51,836 |
| Immigrants | Armenia | 6.6 /100 | #220 | Tragic $51,793 |
| Immigrants | Senegal | 5.8 /100 | #221 | Tragic $51,647 |
| Immigrants | Bangladesh | 5.8 /100 | #222 | Tragic $51,642 |
| Ecuadorians | 5.5 /100 | #223 | Tragic $51,596 |
| Immigrants | Cambodia | 5.5 /100 | #224 | Tragic $51,594 |
| Immigrants | Sudan | 5.0 /100 | #225 | Tragic $51,489 |
| Japanese | 4.9 /100 | #226 | Tragic $51,473 |
| Trinidadians and Tobagonians | 4.8 /100 | #227 | Tragic $51,446 |