Bermudan vs Venezuelan Median Male Earnings
COMPARE
Bermudan
Venezuelan
Median Male Earnings
Median Male Earnings Comparison
Bermudans
Venezuelans
$52,465
MEDIAN MALE EARNINGS
12.1/ 100
METRIC RATING
209th/ 347
METRIC RANK
$52,510
MEDIAN MALE EARNINGS
12.5/ 100
METRIC RATING
208th/ 347
METRIC RANK
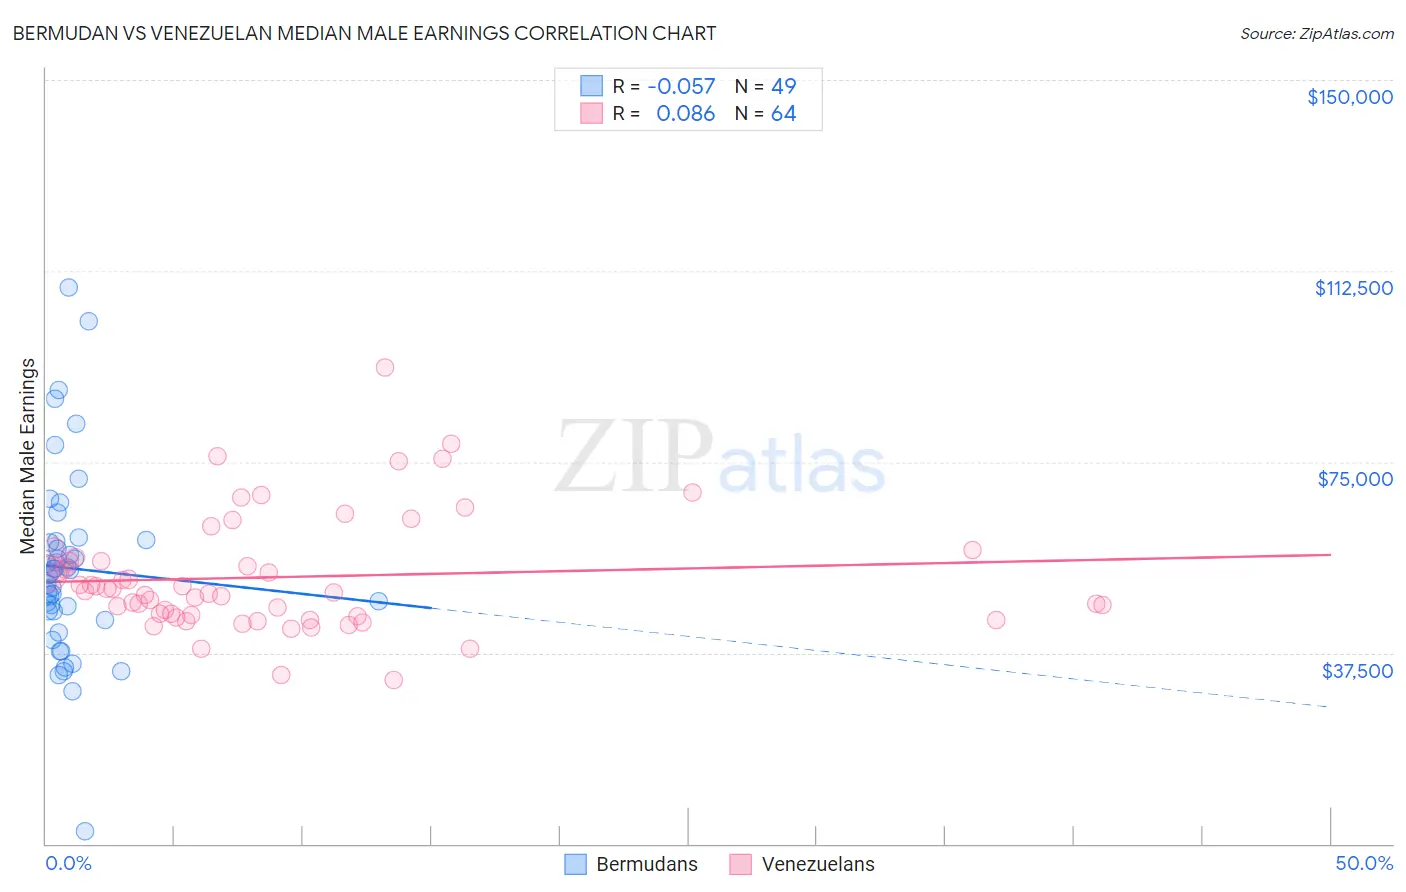
Bermudan vs Venezuelan Median Male Earnings Correlation Chart
The statistical analysis conducted on geographies consisting of 55,727,224 people shows a slight negative correlation between the proportion of Bermudans and median male earnings in the United States with a correlation coefficient (R) of -0.057 and weighted average of $52,465. Similarly, the statistical analysis conducted on geographies consisting of 306,273,362 people shows a slight positive correlation between the proportion of Venezuelans and median male earnings in the United States with a correlation coefficient (R) of 0.086 and weighted average of $52,510, a difference of 0.090%.
Median Male Earnings Correlation Summary
| Measurement | Bermudan | Venezuelan |
| Minimum | $2,499 | $32,054 |
| Maximum | $109,250 | $93,535 |
| Range | $106,751 | $61,481 |
| Mean | $54,094 | $52,370 |
| Median | $53,290 | $49,459 |
| Interquartile 25% (IQ1) | $44,820 | $44,807 |
| Interquartile 75% (IQ3) | $59,519 | $55,925 |
| Interquartile Range (IQR) | $14,700 | $11,117 |
| Standard Deviation (Sample) | $18,662 | $11,420 |
| Standard Deviation (Population) | $18,471 | $11,330 |
Demographics Similar to Bermudans and Venezuelans by Median Male Earnings
In terms of median male earnings, the demographic groups most similar to Bermudans are Delaware ($52,412, a difference of 0.10%), Vietnamese ($52,525, a difference of 0.11%), Tlingit-Haida ($52,409, a difference of 0.11%), Cajun ($52,325, a difference of 0.27%), and Native Hawaiian ($52,306, a difference of 0.30%). Similarly, the demographic groups most similar to Venezuelans are Vietnamese ($52,525, a difference of 0.030%), Delaware ($52,412, a difference of 0.19%), Tlingit-Haida ($52,409, a difference of 0.19%), Immigrants from Iraq ($52,681, a difference of 0.33%), and Cajun ($52,325, a difference of 0.35%).
| Demographics | Rating | Rank | Median Male Earnings |
| Immigrants | Costa Rica | 22.6 /100 | #198 | Fair $53,237 |
| Tongans | 22.3 /100 | #199 | Fair $53,218 |
| Immigrants | Thailand | 17.5 /100 | #200 | Poor $52,908 |
| Immigrants | Bosnia and Herzegovina | 16.9 /100 | #201 | Poor $52,869 |
| Immigrants | Uruguay | 16.8 /100 | #202 | Poor $52,860 |
| Panamanians | 16.5 /100 | #203 | Poor $52,835 |
| Ghanaians | 16.1 /100 | #204 | Poor $52,810 |
| Immigrants | Colombia | 15.0 /100 | #205 | Poor $52,725 |
| Immigrants | Iraq | 14.5 /100 | #206 | Poor $52,681 |
| Vietnamese | 12.7 /100 | #207 | Poor $52,525 |
| Venezuelans | 12.5 /100 | #208 | Poor $52,510 |
| Bermudans | 12.1 /100 | #209 | Poor $52,465 |
| Delaware | 11.5 /100 | #210 | Poor $52,412 |
| Tlingit-Haida | 11.5 /100 | #211 | Poor $52,409 |
| Cajuns | 10.7 /100 | #212 | Poor $52,325 |
| Native Hawaiians | 10.5 /100 | #213 | Poor $52,306 |
| Immigrants | Nonimmigrants | 9.3 /100 | #214 | Tragic $52,170 |
| Immigrants | Cameroon | 8.9 /100 | #215 | Tragic $52,119 |
| Immigrants | Venezuela | 8.3 /100 | #216 | Tragic $52,041 |
| Nigerians | 8.3 /100 | #217 | Tragic $52,039 |
| Immigrants | Panama | 7.7 /100 | #218 | Tragic $51,962 |