Yuman vs Czech Median Male Earnings
COMPARE
Yuman
Czech
Median Male Earnings
Median Male Earnings Comparison
Yuman
Czechs
$45,446
MEDIAN MALE EARNINGS
0.0/ 100
METRIC RATING
325th/ 347
METRIC RANK
$56,546
MEDIAN MALE EARNINGS
88.2/ 100
METRIC RATING
132nd/ 347
METRIC RANK
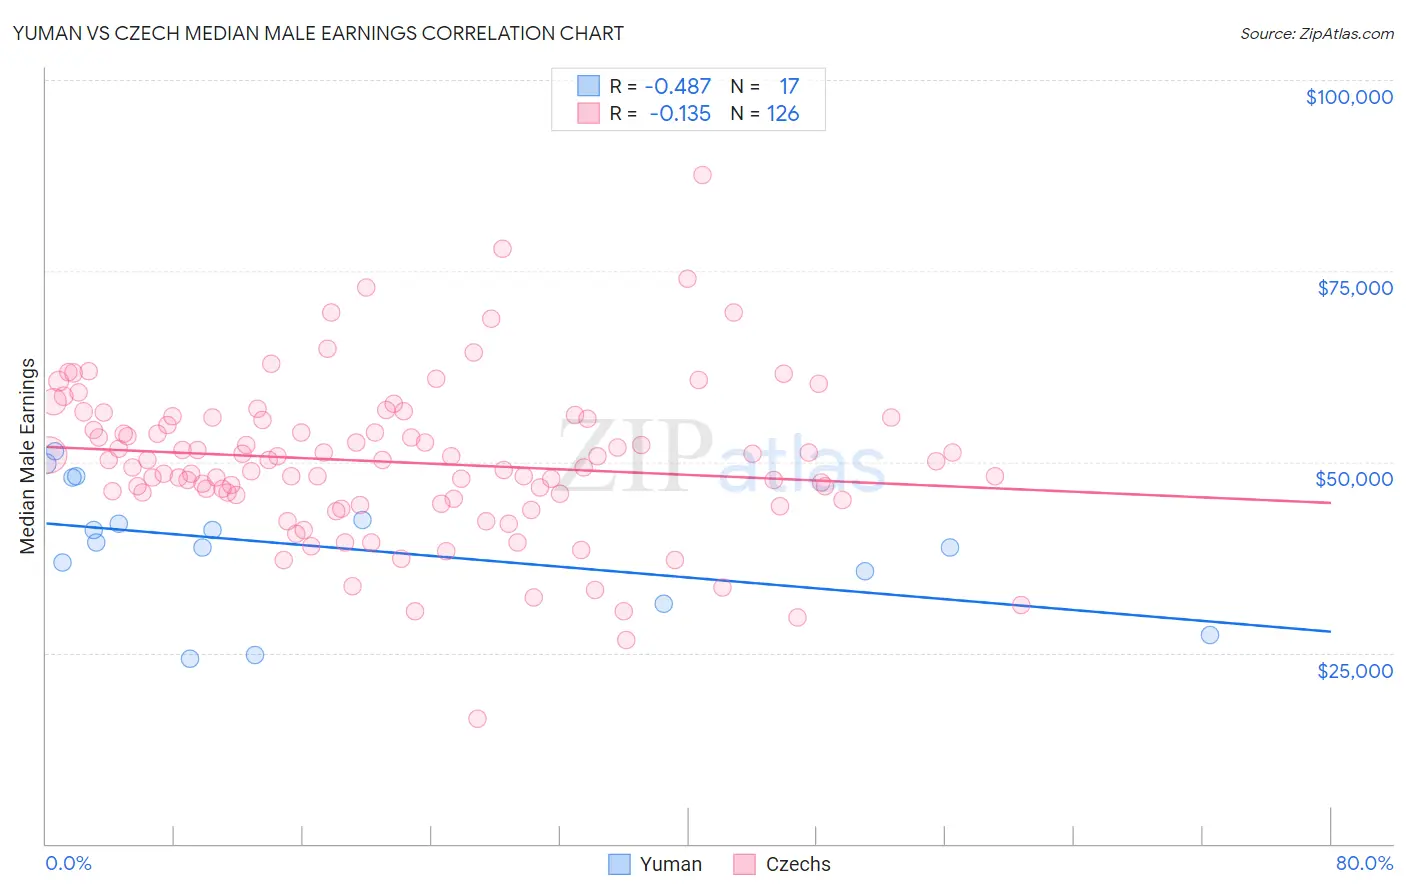
Yuman vs Czech Median Male Earnings Correlation Chart
The statistical analysis conducted on geographies consisting of 40,680,371 people shows a moderate negative correlation between the proportion of Yuman and median male earnings in the United States with a correlation coefficient (R) of -0.487 and weighted average of $45,446. Similarly, the statistical analysis conducted on geographies consisting of 484,464,661 people shows a poor negative correlation between the proportion of Czechs and median male earnings in the United States with a correlation coefficient (R) of -0.135 and weighted average of $56,546, a difference of 24.4%.
Median Male Earnings Correlation Summary
| Measurement | Yuman | Czech |
| Minimum | $24,301 | $16,298 |
| Maximum | $51,445 | $87,500 |
| Range | $27,144 | $71,202 |
| Mean | $38,868 | $49,947 |
| Median | $39,436 | $50,154 |
| Interquartile 25% (IQ1) | $33,507 | $45,179 |
| Interquartile 75% (IQ3) | $45,172 | $55,641 |
| Interquartile Range (IQR) | $11,665 | $10,462 |
| Standard Deviation (Sample) | $8,269 | $10,298 |
| Standard Deviation (Population) | $8,022 | $10,257 |
Similar Demographics by Median Male Earnings
Demographics Similar to Yuman by Median Male Earnings
In terms of median male earnings, the demographic groups most similar to Yuman are Black/African American ($45,523, a difference of 0.17%), Immigrants from Central America ($45,538, a difference of 0.20%), Sioux ($45,566, a difference of 0.26%), Fijian ($45,607, a difference of 0.35%), and Immigrants from Haiti ($45,266, a difference of 0.40%).
| Demographics | Rating | Rank | Median Male Earnings |
| Cheyenne | 0.0 /100 | #318 | Tragic $46,062 |
| Haitians | 0.0 /100 | #319 | Tragic $45,903 |
| Immigrants | Honduras | 0.0 /100 | #320 | Tragic $45,787 |
| Fijians | 0.0 /100 | #321 | Tragic $45,607 |
| Sioux | 0.0 /100 | #322 | Tragic $45,566 |
| Immigrants | Central America | 0.0 /100 | #323 | Tragic $45,538 |
| Blacks/African Americans | 0.0 /100 | #324 | Tragic $45,523 |
| Yuman | 0.0 /100 | #325 | Tragic $45,446 |
| Immigrants | Haiti | 0.0 /100 | #326 | Tragic $45,266 |
| Immigrants | Bahamas | 0.0 /100 | #327 | Tragic $45,176 |
| Kiowa | 0.0 /100 | #328 | Tragic $45,094 |
| Yakama | 0.0 /100 | #329 | Tragic $45,002 |
| Immigrants | Mexico | 0.0 /100 | #330 | Tragic $44,960 |
| Natives/Alaskans | 0.0 /100 | #331 | Tragic $44,775 |
| Bahamians | 0.0 /100 | #332 | Tragic $44,756 |
Demographics Similar to Czechs by Median Male Earnings
In terms of median male earnings, the demographic groups most similar to Czechs are Immigrants from Germany ($56,542, a difference of 0.010%), Moroccan ($56,499, a difference of 0.080%), Irish ($56,464, a difference of 0.14%), Immigrants from Saudi Arabia ($56,452, a difference of 0.17%), and Portuguese ($56,663, a difference of 0.21%).
| Demographics | Rating | Rank | Median Male Earnings |
| Immigrants | Morocco | 91.8 /100 | #125 | Exceptional $56,958 |
| Chinese | 91.1 /100 | #126 | Exceptional $56,872 |
| Brazilians | 90.9 /100 | #127 | Exceptional $56,837 |
| Immigrants | Syria | 90.8 /100 | #128 | Exceptional $56,830 |
| Pakistanis | 89.9 /100 | #129 | Excellent $56,719 |
| Koreans | 89.4 /100 | #130 | Excellent $56,672 |
| Portuguese | 89.4 /100 | #131 | Excellent $56,663 |
| Czechs | 88.2 /100 | #132 | Excellent $56,546 |
| Immigrants | Germany | 88.2 /100 | #133 | Excellent $56,542 |
| Moroccans | 87.7 /100 | #134 | Excellent $56,499 |
| Irish | 87.4 /100 | #135 | Excellent $56,464 |
| Immigrants | Saudi Arabia | 87.2 /100 | #136 | Excellent $56,452 |
| Slavs | 86.5 /100 | #137 | Excellent $56,390 |
| Slovaks | 85.5 /100 | #138 | Excellent $56,306 |
| Zimbabweans | 85.5 /100 | #139 | Excellent $56,302 |