Puget Sound Salish vs Venezuelan Median Male Earnings
COMPARE
Puget Sound Salish
Venezuelan
Median Male Earnings
Median Male Earnings Comparison
Puget Sound Salish
Venezuelans
$53,704
MEDIAN MALE EARNINGS
31.6/ 100
METRIC RATING
189th/ 347
METRIC RANK
$52,510
MEDIAN MALE EARNINGS
12.5/ 100
METRIC RATING
208th/ 347
METRIC RANK
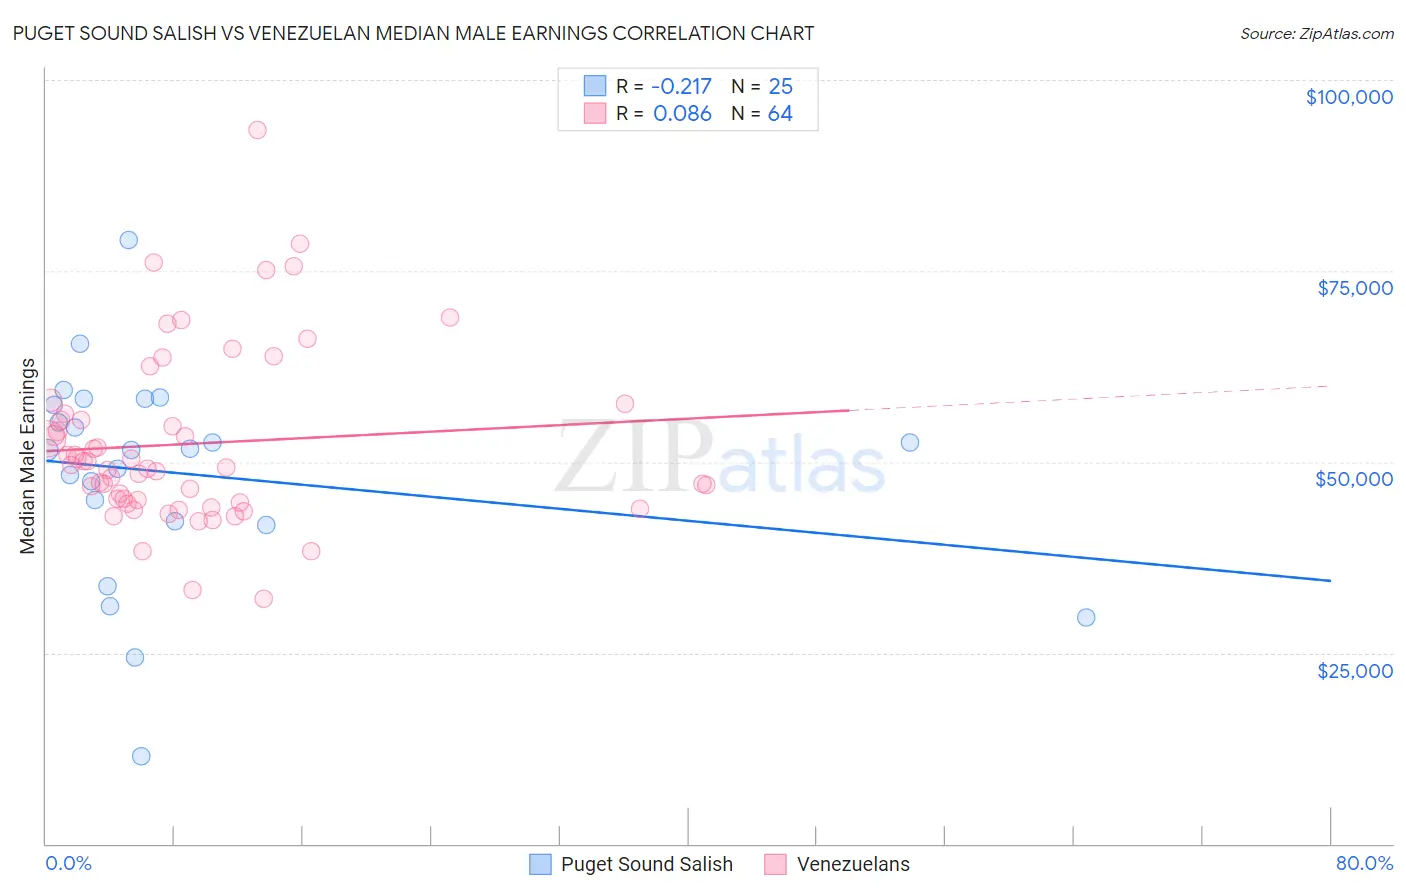
Puget Sound Salish vs Venezuelan Median Male Earnings Correlation Chart
The statistical analysis conducted on geographies consisting of 46,150,456 people shows a weak negative correlation between the proportion of Puget Sound Salish and median male earnings in the United States with a correlation coefficient (R) of -0.217 and weighted average of $53,704. Similarly, the statistical analysis conducted on geographies consisting of 306,273,362 people shows a slight positive correlation between the proportion of Venezuelans and median male earnings in the United States with a correlation coefficient (R) of 0.086 and weighted average of $52,510, a difference of 2.3%.
Median Male Earnings Correlation Summary
| Measurement | Puget Sound Salish | Venezuelan |
| Minimum | $11,507 | $32,054 |
| Maximum | $79,042 | $93,535 |
| Range | $67,535 | $61,481 |
| Mean | $48,401 | $52,370 |
| Median | $51,583 | $49,459 |
| Interquartile 25% (IQ1) | $42,007 | $44,807 |
| Interquartile 75% (IQ3) | $57,855 | $55,925 |
| Interquartile Range (IQR) | $15,848 | $11,117 |
| Standard Deviation (Sample) | $14,112 | $11,420 |
| Standard Deviation (Population) | $13,827 | $11,330 |
Demographics Similar to Puget Sound Salish and Venezuelans by Median Male Earnings
In terms of median male earnings, the demographic groups most similar to Puget Sound Salish are Immigrants from Eastern Africa ($53,713, a difference of 0.020%), Uruguayan ($53,680, a difference of 0.040%), Guamanian/Chamorro ($53,661, a difference of 0.080%), Scotch-Irish ($53,658, a difference of 0.090%), and Kenyan ($53,647, a difference of 0.11%). Similarly, the demographic groups most similar to Venezuelans are Vietnamese ($52,525, a difference of 0.030%), Immigrants from Iraq ($52,681, a difference of 0.33%), Immigrants from Colombia ($52,725, a difference of 0.41%), Ghanaian ($52,810, a difference of 0.57%), and Panamanian ($52,835, a difference of 0.62%).
| Demographics | Rating | Rank | Median Male Earnings |
| Immigrants | Eastern Africa | 31.8 /100 | #188 | Fair $53,713 |
| Puget Sound Salish | 31.6 /100 | #189 | Fair $53,704 |
| Uruguayans | 31.1 /100 | #190 | Fair $53,680 |
| Guamanians/Chamorros | 30.7 /100 | #191 | Fair $53,661 |
| Scotch-Irish | 30.6 /100 | #192 | Fair $53,658 |
| Kenyans | 30.4 /100 | #193 | Fair $53,647 |
| Spanish | 29.0 /100 | #194 | Fair $53,576 |
| Immigrants | Azores | 27.5 /100 | #195 | Fair $53,503 |
| Immigrants | Africa | 26.6 /100 | #196 | Fair $53,457 |
| Immigrants | Kenya | 26.0 /100 | #197 | Fair $53,427 |
| Immigrants | Costa Rica | 22.6 /100 | #198 | Fair $53,237 |
| Tongans | 22.3 /100 | #199 | Fair $53,218 |
| Immigrants | Thailand | 17.5 /100 | #200 | Poor $52,908 |
| Immigrants | Bosnia and Herzegovina | 16.9 /100 | #201 | Poor $52,869 |
| Immigrants | Uruguay | 16.8 /100 | #202 | Poor $52,860 |
| Panamanians | 16.5 /100 | #203 | Poor $52,835 |
| Ghanaians | 16.1 /100 | #204 | Poor $52,810 |
| Immigrants | Colombia | 15.0 /100 | #205 | Poor $52,725 |
| Immigrants | Iraq | 14.5 /100 | #206 | Poor $52,681 |
| Vietnamese | 12.7 /100 | #207 | Poor $52,525 |
| Venezuelans | 12.5 /100 | #208 | Poor $52,510 |