Yugoslavian vs Immigrants from Australia Median Household Income
COMPARE
Yugoslavian
Immigrants from Australia
Median Household Income
Median Household Income Comparison
Yugoslavians
Immigrants from Australia
$82,186
MEDIAN HOUSEHOLD INCOME
13.3/ 100
METRIC RATING
216th/ 347
METRIC RANK
$102,562
MEDIAN HOUSEHOLD INCOME
100.0/ 100
METRIC RATING
19th/ 347
METRIC RANK
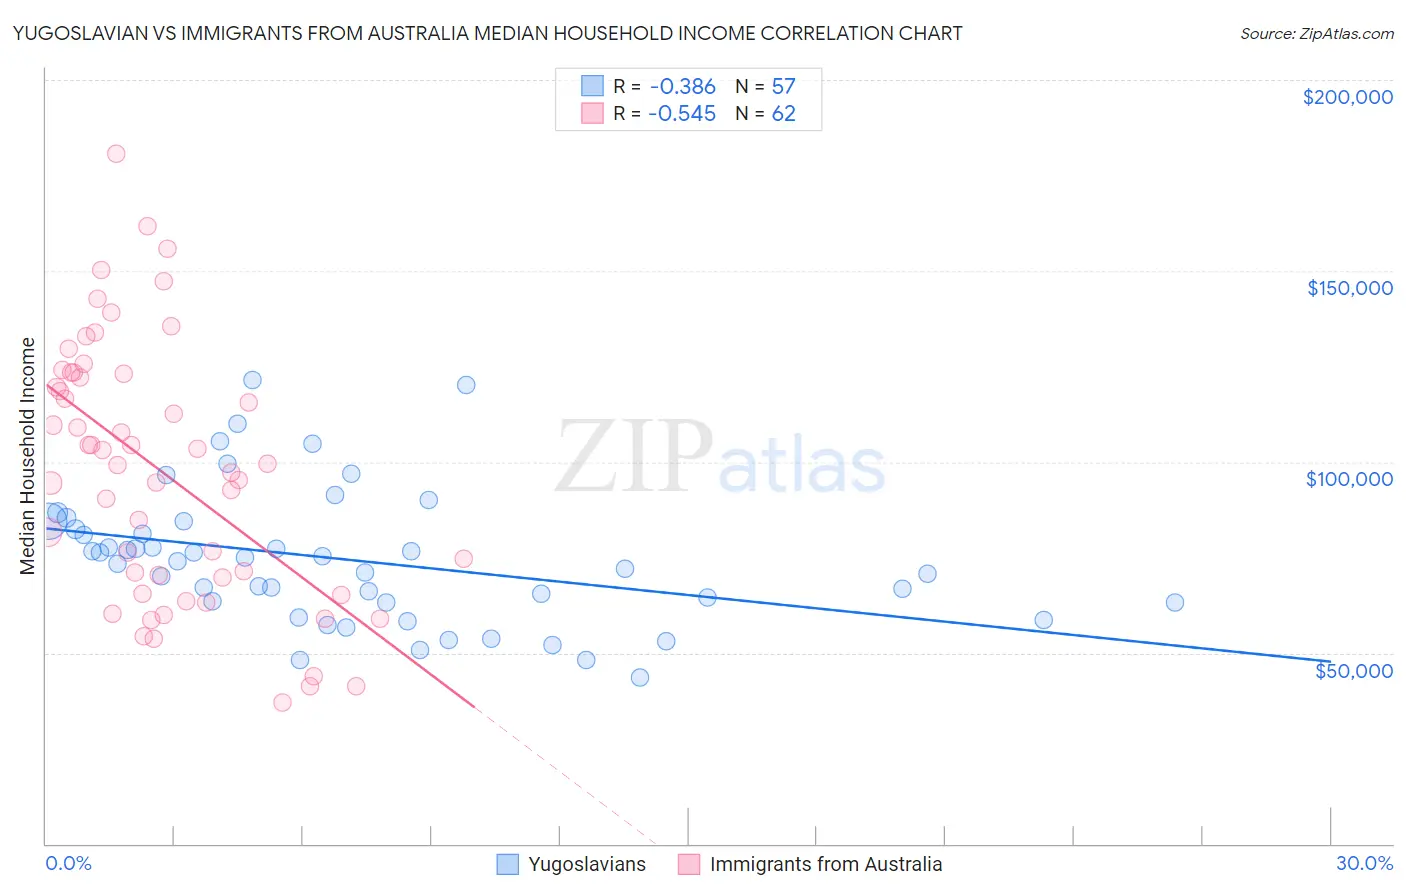
Yugoslavian vs Immigrants from Australia Median Household Income Correlation Chart
The statistical analysis conducted on geographies consisting of 285,592,338 people shows a mild negative correlation between the proportion of Yugoslavians and median household income in the United States with a correlation coefficient (R) of -0.386 and weighted average of $82,186. Similarly, the statistical analysis conducted on geographies consisting of 227,116,578 people shows a substantial negative correlation between the proportion of Immigrants from Australia and median household income in the United States with a correlation coefficient (R) of -0.545 and weighted average of $102,562, a difference of 24.8%.
Median Household Income Correlation Summary
| Measurement | Yugoslavian | Immigrants from Australia |
| Minimum | $43,409 | $36,932 |
| Maximum | $121,486 | $180,529 |
| Range | $78,077 | $143,597 |
| Mean | $74,414 | $97,516 |
| Median | $74,058 | $99,226 |
| Interquartile 25% (IQ1) | $63,141 | $69,750 |
| Interquartile 75% (IQ3) | $83,356 | $123,199 |
| Interquartile Range (IQR) | $20,215 | $53,449 |
| Standard Deviation (Sample) | $17,545 | $33,443 |
| Standard Deviation (Population) | $17,391 | $33,173 |
Similar Demographics by Median Household Income
Demographics Similar to Yugoslavians by Median Household Income
In terms of median household income, the demographic groups most similar to Yugoslavians are Vietnamese ($82,248, a difference of 0.070%), Panamanian ($82,272, a difference of 0.10%), Ecuadorian ($82,070, a difference of 0.14%), White/Caucasian ($82,029, a difference of 0.19%), and Nepalese ($82,410, a difference of 0.27%).
| Demographics | Rating | Rank | Median Household Income |
| Immigrants | Iraq | 16.7 /100 | #209 | Poor $82,594 |
| Immigrants | Uruguay | 16.4 /100 | #210 | Poor $82,560 |
| Salvadorans | 15.4 /100 | #211 | Poor $82,449 |
| Venezuelans | 15.3 /100 | #212 | Poor $82,432 |
| Nepalese | 15.1 /100 | #213 | Poor $82,410 |
| Panamanians | 14.0 /100 | #214 | Poor $82,272 |
| Vietnamese | 13.8 /100 | #215 | Poor $82,248 |
| Yugoslavians | 13.3 /100 | #216 | Poor $82,186 |
| Ecuadorians | 12.5 /100 | #217 | Poor $82,070 |
| Whites/Caucasians | 12.2 /100 | #218 | Poor $82,029 |
| Nigerians | 10.3 /100 | #219 | Poor $81,725 |
| Immigrants | Venezuela | 9.0 /100 | #220 | Tragic $81,506 |
| Immigrants | Ghana | 9.0 /100 | #221 | Tragic $81,489 |
| Immigrants | Nigeria | 7.7 /100 | #222 | Tragic $81,236 |
| Immigrants | El Salvador | 7.6 /100 | #223 | Tragic $81,213 |
Demographics Similar to Immigrants from Australia by Median Household Income
In terms of median household income, the demographic groups most similar to Immigrants from Australia are Cypriot ($102,843, a difference of 0.27%), Bolivian ($102,195, a difference of 0.36%), Immigrants from Korea ($102,962, a difference of 0.39%), Burmese ($103,145, a difference of 0.57%), and Eastern European ($101,781, a difference of 0.77%).
| Demographics | Rating | Rank | Median Household Income |
| Indians (Asian) | 100.0 /100 | #12 | Exceptional $105,262 |
| Immigrants | Eastern Asia | 100.0 /100 | #13 | Exceptional $104,796 |
| Immigrants | Ireland | 100.0 /100 | #14 | Exceptional $104,692 |
| Immigrants | Israel | 100.0 /100 | #15 | Exceptional $104,090 |
| Burmese | 100.0 /100 | #16 | Exceptional $103,145 |
| Immigrants | Korea | 100.0 /100 | #17 | Exceptional $102,962 |
| Cypriots | 100.0 /100 | #18 | Exceptional $102,843 |
| Immigrants | Australia | 100.0 /100 | #19 | Exceptional $102,562 |
| Bolivians | 100.0 /100 | #20 | Exceptional $102,195 |
| Eastern Europeans | 100.0 /100 | #21 | Exceptional $101,781 |
| Asians | 100.0 /100 | #22 | Exceptional $101,681 |
| Immigrants | Bolivia | 100.0 /100 | #23 | Exceptional $101,394 |
| Immigrants | Japan | 100.0 /100 | #24 | Exceptional $100,711 |
| Immigrants | Sweden | 100.0 /100 | #25 | Exceptional $100,699 |
| Immigrants | Belgium | 100.0 /100 | #26 | Exceptional $100,306 |