Yugoslavian vs Immigrants from Lithuania Median Household Income
COMPARE
Yugoslavian
Immigrants from Lithuania
Median Household Income
Median Household Income Comparison
Yugoslavians
Immigrants from Lithuania
$82,186
MEDIAN HOUSEHOLD INCOME
13.3/ 100
METRIC RATING
216th/ 347
METRIC RANK
$96,836
MEDIAN HOUSEHOLD INCOME
99.9/ 100
METRIC RATING
42nd/ 347
METRIC RANK
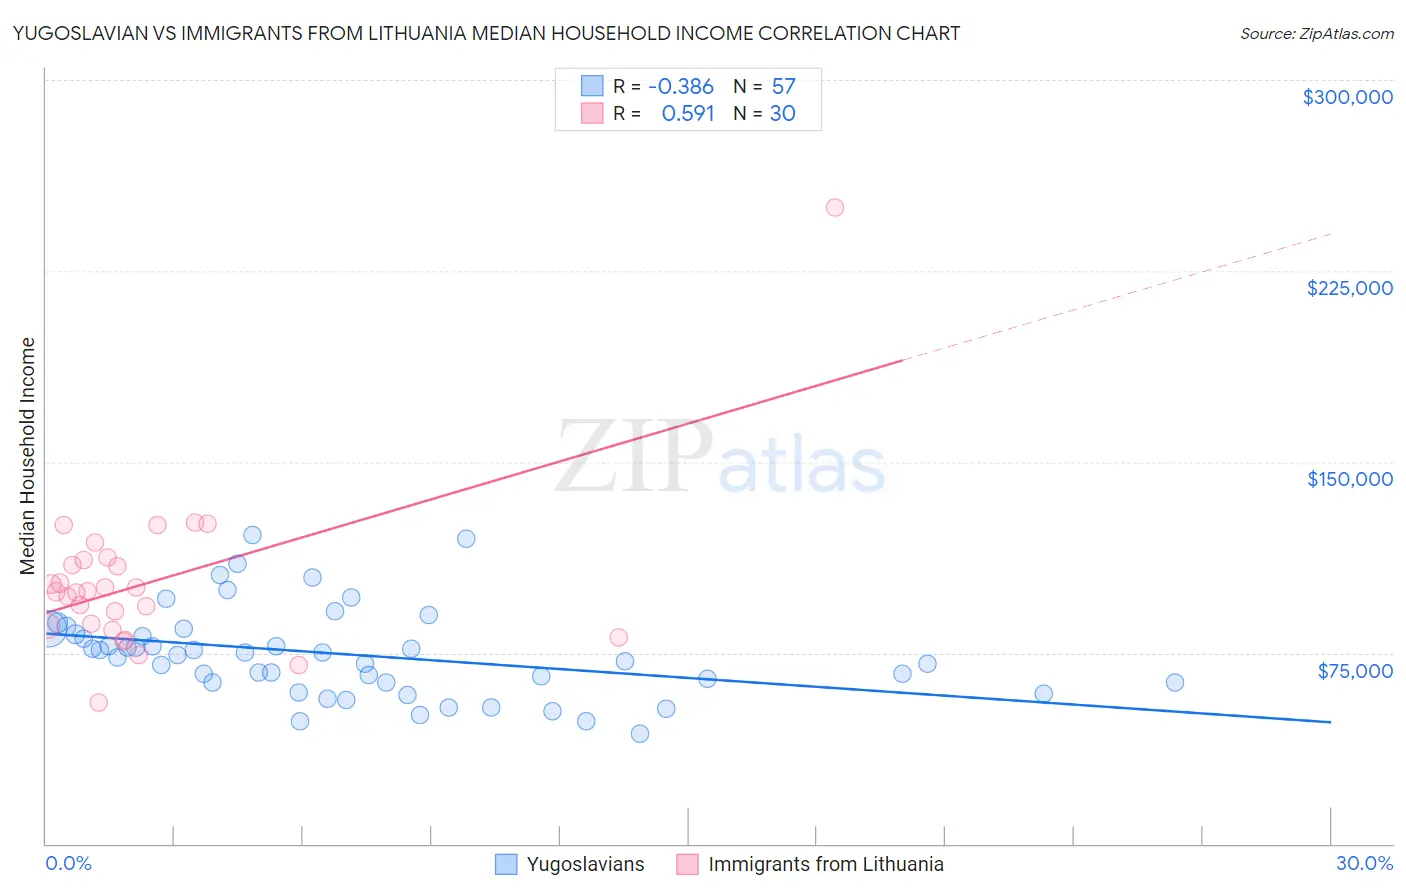
Yugoslavian vs Immigrants from Lithuania Median Household Income Correlation Chart
The statistical analysis conducted on geographies consisting of 285,592,338 people shows a mild negative correlation between the proportion of Yugoslavians and median household income in the United States with a correlation coefficient (R) of -0.386 and weighted average of $82,186. Similarly, the statistical analysis conducted on geographies consisting of 117,713,976 people shows a substantial positive correlation between the proportion of Immigrants from Lithuania and median household income in the United States with a correlation coefficient (R) of 0.591 and weighted average of $96,836, a difference of 17.8%.
Median Household Income Correlation Summary
| Measurement | Yugoslavian | Immigrants from Lithuania |
| Minimum | $43,409 | $55,636 |
| Maximum | $121,486 | $250,001 |
| Range | $78,077 | $194,365 |
| Mean | $74,414 | $102,979 |
| Median | $74,058 | $99,018 |
| Interquartile 25% (IQ1) | $63,141 | $85,668 |
| Interquartile 75% (IQ3) | $83,356 | $111,586 |
| Interquartile Range (IQR) | $20,215 | $25,918 |
| Standard Deviation (Sample) | $17,545 | $32,780 |
| Standard Deviation (Population) | $17,391 | $32,229 |
Similar Demographics by Median Household Income
Demographics Similar to Yugoslavians by Median Household Income
In terms of median household income, the demographic groups most similar to Yugoslavians are Vietnamese ($82,248, a difference of 0.070%), Panamanian ($82,272, a difference of 0.10%), Ecuadorian ($82,070, a difference of 0.14%), White/Caucasian ($82,029, a difference of 0.19%), and Nepalese ($82,410, a difference of 0.27%).
| Demographics | Rating | Rank | Median Household Income |
| Immigrants | Iraq | 16.7 /100 | #209 | Poor $82,594 |
| Immigrants | Uruguay | 16.4 /100 | #210 | Poor $82,560 |
| Salvadorans | 15.4 /100 | #211 | Poor $82,449 |
| Venezuelans | 15.3 /100 | #212 | Poor $82,432 |
| Nepalese | 15.1 /100 | #213 | Poor $82,410 |
| Panamanians | 14.0 /100 | #214 | Poor $82,272 |
| Vietnamese | 13.8 /100 | #215 | Poor $82,248 |
| Yugoslavians | 13.3 /100 | #216 | Poor $82,186 |
| Ecuadorians | 12.5 /100 | #217 | Poor $82,070 |
| Whites/Caucasians | 12.2 /100 | #218 | Poor $82,029 |
| Nigerians | 10.3 /100 | #219 | Poor $81,725 |
| Immigrants | Venezuela | 9.0 /100 | #220 | Tragic $81,506 |
| Immigrants | Ghana | 9.0 /100 | #221 | Tragic $81,489 |
| Immigrants | Nigeria | 7.7 /100 | #222 | Tragic $81,236 |
| Immigrants | El Salvador | 7.6 /100 | #223 | Tragic $81,213 |
Demographics Similar to Immigrants from Lithuania by Median Household Income
In terms of median household income, the demographic groups most similar to Immigrants from Lithuania are Immigrants from France ($96,743, a difference of 0.10%), Immigrants from Turkey ($96,964, a difference of 0.13%), Immigrants from Greece ($96,675, a difference of 0.17%), Maltese ($97,015, a difference of 0.18%), and Afghan ($97,026, a difference of 0.20%).
| Demographics | Rating | Rank | Median Household Income |
| Immigrants | Switzerland | 100.0 /100 | #35 | Exceptional $97,979 |
| Immigrants | Pakistan | 100.0 /100 | #36 | Exceptional $97,528 |
| Latvians | 100.0 /100 | #37 | Exceptional $97,311 |
| Immigrants | Indonesia | 100.0 /100 | #38 | Exceptional $97,297 |
| Afghans | 100.0 /100 | #39 | Exceptional $97,026 |
| Maltese | 100.0 /100 | #40 | Exceptional $97,015 |
| Immigrants | Turkey | 100.0 /100 | #41 | Exceptional $96,964 |
| Immigrants | Lithuania | 99.9 /100 | #42 | Exceptional $96,836 |
| Immigrants | France | 99.9 /100 | #43 | Exceptional $96,743 |
| Immigrants | Greece | 99.9 /100 | #44 | Exceptional $96,675 |
| Israelis | 99.9 /100 | #45 | Exceptional $96,552 |
| Australians | 99.9 /100 | #46 | Exceptional $96,490 |
| Immigrants | Russia | 99.9 /100 | #47 | Exceptional $96,378 |
| Cambodians | 99.9 /100 | #48 | Exceptional $96,324 |
| Immigrants | Malaysia | 99.9 /100 | #49 | Exceptional $96,292 |