Yugoslavian vs Immigrants from Micronesia Median Household Income
COMPARE
Yugoslavian
Immigrants from Micronesia
Median Household Income
Median Household Income Comparison
Yugoslavians
Immigrants from Micronesia
$82,186
MEDIAN HOUSEHOLD INCOME
13.3/ 100
METRIC RATING
216th/ 347
METRIC RANK
$75,574
MEDIAN HOUSEHOLD INCOME
0.2/ 100
METRIC RATING
275th/ 347
METRIC RANK
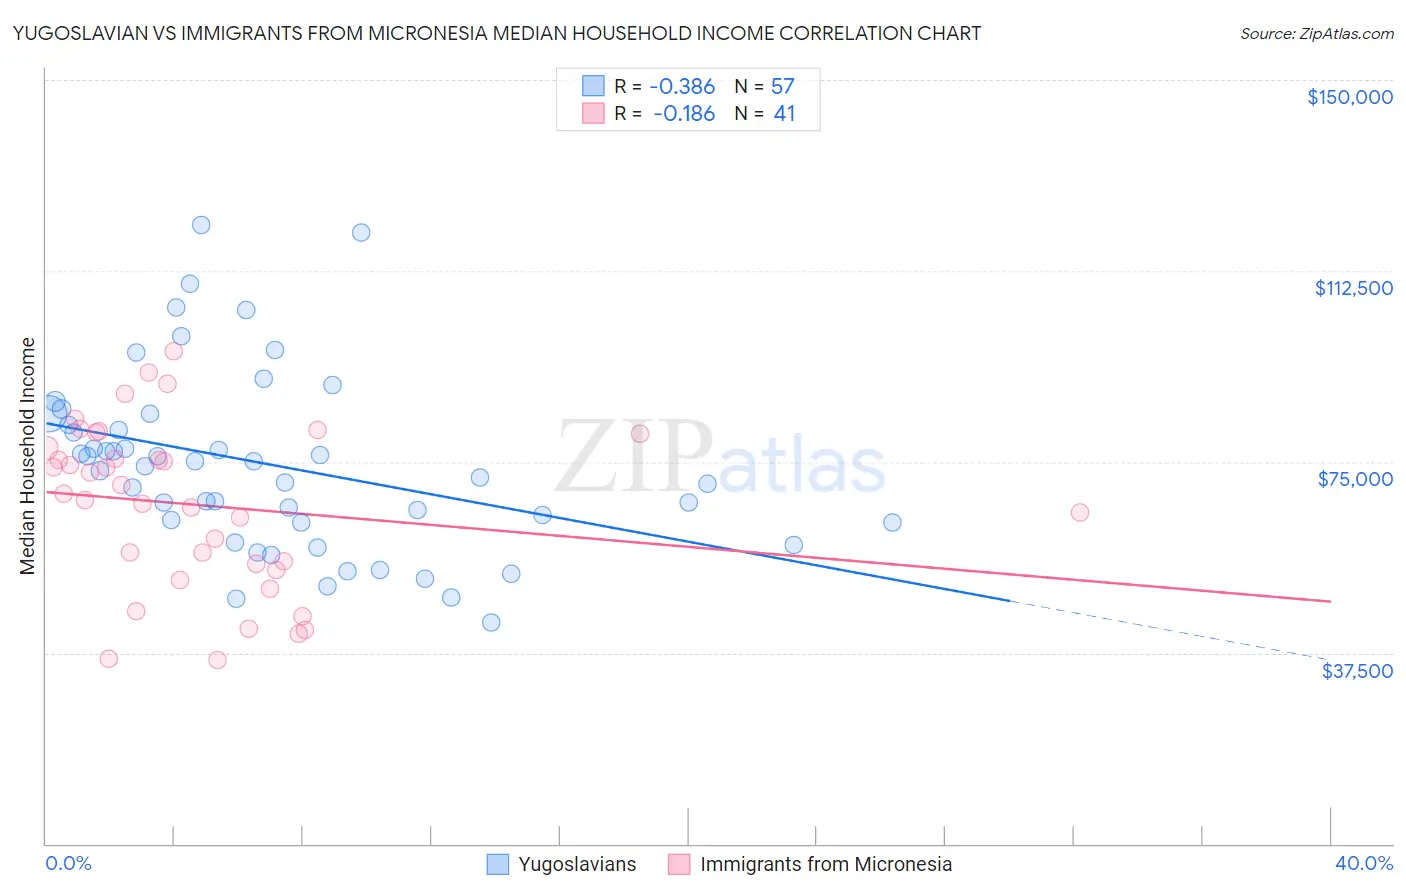
Yugoslavian vs Immigrants from Micronesia Median Household Income Correlation Chart
The statistical analysis conducted on geographies consisting of 285,592,338 people shows a mild negative correlation between the proportion of Yugoslavians and median household income in the United States with a correlation coefficient (R) of -0.386 and weighted average of $82,186. Similarly, the statistical analysis conducted on geographies consisting of 61,597,439 people shows a poor negative correlation between the proportion of Immigrants from Micronesia and median household income in the United States with a correlation coefficient (R) of -0.186 and weighted average of $75,574, a difference of 8.7%.
Median Household Income Correlation Summary
| Measurement | Yugoslavian | Immigrants from Micronesia |
| Minimum | $43,409 | $36,071 |
| Maximum | $121,486 | $96,614 |
| Range | $78,077 | $60,543 |
| Mean | $74,414 | $66,523 |
| Median | $74,058 | $68,636 |
| Interquartile 25% (IQ1) | $63,141 | $54,388 |
| Interquartile 75% (IQ3) | $83,356 | $79,184 |
| Interquartile Range (IQR) | $20,215 | $24,796 |
| Standard Deviation (Sample) | $17,545 | $16,084 |
| Standard Deviation (Population) | $17,391 | $15,887 |
Similar Demographics by Median Household Income
Demographics Similar to Yugoslavians by Median Household Income
In terms of median household income, the demographic groups most similar to Yugoslavians are Vietnamese ($82,248, a difference of 0.070%), Panamanian ($82,272, a difference of 0.10%), Ecuadorian ($82,070, a difference of 0.14%), White/Caucasian ($82,029, a difference of 0.19%), and Nepalese ($82,410, a difference of 0.27%).
| Demographics | Rating | Rank | Median Household Income |
| Immigrants | Iraq | 16.7 /100 | #209 | Poor $82,594 |
| Immigrants | Uruguay | 16.4 /100 | #210 | Poor $82,560 |
| Salvadorans | 15.4 /100 | #211 | Poor $82,449 |
| Venezuelans | 15.3 /100 | #212 | Poor $82,432 |
| Nepalese | 15.1 /100 | #213 | Poor $82,410 |
| Panamanians | 14.0 /100 | #214 | Poor $82,272 |
| Vietnamese | 13.8 /100 | #215 | Poor $82,248 |
| Yugoslavians | 13.3 /100 | #216 | Poor $82,186 |
| Ecuadorians | 12.5 /100 | #217 | Poor $82,070 |
| Whites/Caucasians | 12.2 /100 | #218 | Poor $82,029 |
| Nigerians | 10.3 /100 | #219 | Poor $81,725 |
| Immigrants | Venezuela | 9.0 /100 | #220 | Tragic $81,506 |
| Immigrants | Ghana | 9.0 /100 | #221 | Tragic $81,489 |
| Immigrants | Nigeria | 7.7 /100 | #222 | Tragic $81,236 |
| Immigrants | El Salvador | 7.6 /100 | #223 | Tragic $81,213 |
Demographics Similar to Immigrants from Micronesia by Median Household Income
In terms of median household income, the demographic groups most similar to Immigrants from Micronesia are British West Indian ($75,647, a difference of 0.10%), Liberian ($75,667, a difference of 0.12%), Immigrants from Latin America ($75,420, a difference of 0.20%), Spanish American ($75,386, a difference of 0.25%), and Somali ($75,782, a difference of 0.27%).
| Demographics | Rating | Rank | Median Household Income |
| Immigrants | Jamaica | 0.3 /100 | #268 | Tragic $75,851 |
| Cape Verdeans | 0.3 /100 | #269 | Tragic $75,848 |
| Hmong | 0.3 /100 | #270 | Tragic $75,839 |
| Pennsylvania Germans | 0.3 /100 | #271 | Tragic $75,814 |
| Somalis | 0.3 /100 | #272 | Tragic $75,782 |
| Liberians | 0.2 /100 | #273 | Tragic $75,667 |
| British West Indians | 0.2 /100 | #274 | Tragic $75,647 |
| Immigrants | Micronesia | 0.2 /100 | #275 | Tragic $75,574 |
| Immigrants | Latin America | 0.2 /100 | #276 | Tragic $75,420 |
| Spanish Americans | 0.2 /100 | #277 | Tragic $75,386 |
| Osage | 0.2 /100 | #278 | Tragic $75,240 |
| Immigrants | Guatemala | 0.2 /100 | #279 | Tragic $75,123 |
| Senegalese | 0.2 /100 | #280 | Tragic $74,999 |
| Immigrants | Liberia | 0.1 /100 | #281 | Tragic $74,896 |
| Central American Indians | 0.1 /100 | #282 | Tragic $74,847 |