Yugoslavian vs Welsh Median Household Income
COMPARE
Yugoslavian
Welsh
Median Household Income
Median Household Income Comparison
Yugoslavians
Welsh
$82,186
MEDIAN HOUSEHOLD INCOME
13.3/ 100
METRIC RATING
216th/ 347
METRIC RANK
$83,628
MEDIAN HOUSEHOLD INCOME
28.0/ 100
METRIC RATING
192nd/ 347
METRIC RANK
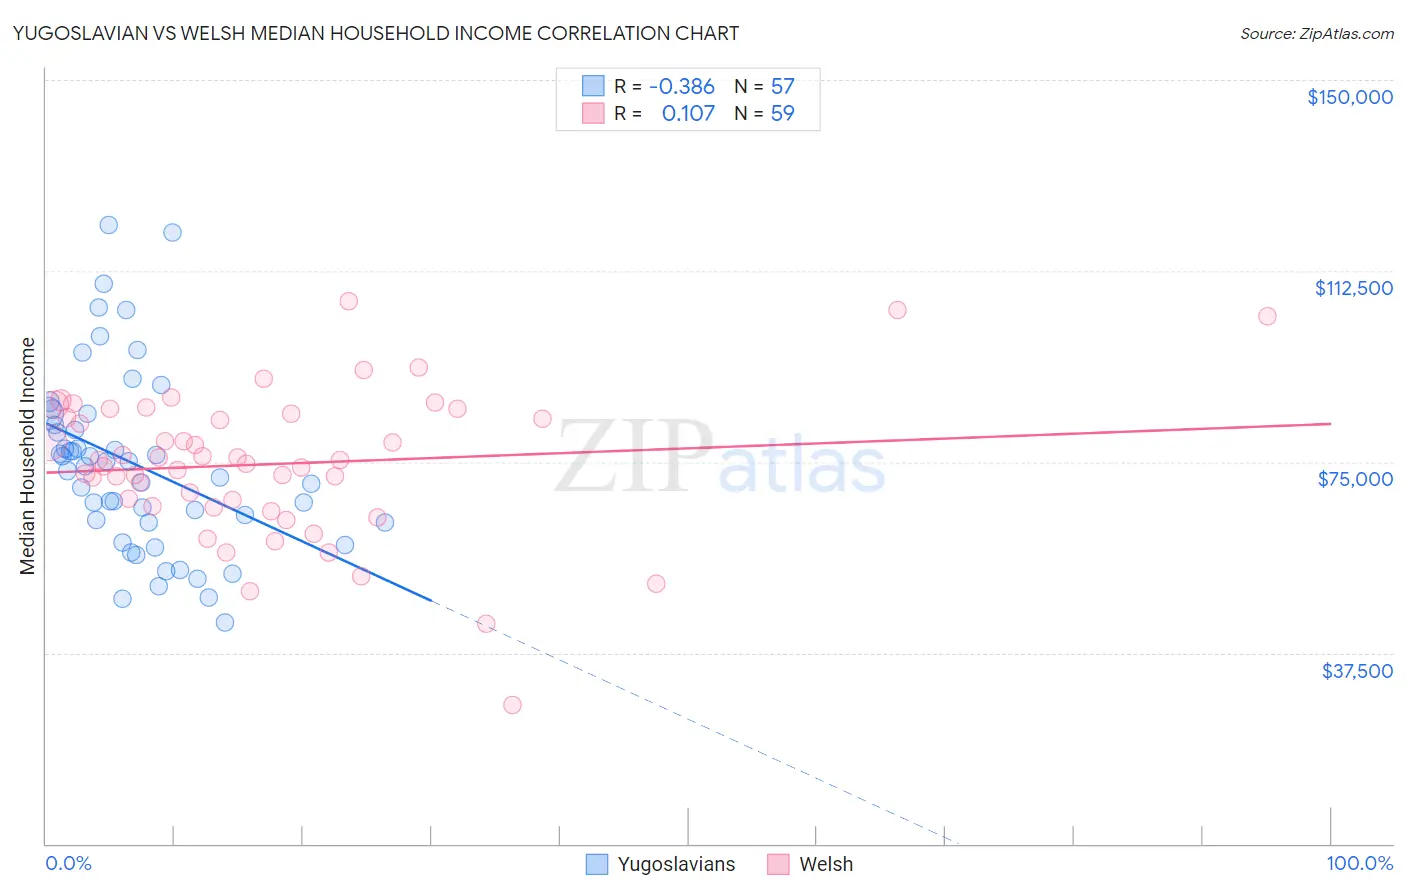
Yugoslavian vs Welsh Median Household Income Correlation Chart
The statistical analysis conducted on geographies consisting of 285,592,338 people shows a mild negative correlation between the proportion of Yugoslavians and median household income in the United States with a correlation coefficient (R) of -0.386 and weighted average of $82,186. Similarly, the statistical analysis conducted on geographies consisting of 527,928,431 people shows a poor positive correlation between the proportion of Welsh and median household income in the United States with a correlation coefficient (R) of 0.107 and weighted average of $83,628, a difference of 1.8%.
Median Household Income Correlation Summary
| Measurement | Yugoslavian | Welsh |
| Minimum | $43,409 | $27,188 |
| Maximum | $121,486 | $106,528 |
| Range | $78,077 | $79,340 |
| Mean | $74,414 | $74,552 |
| Median | $74,058 | $75,263 |
| Interquartile 25% (IQ1) | $63,141 | $66,384 |
| Interquartile 75% (IQ3) | $83,356 | $84,494 |
| Interquartile Range (IQR) | $20,215 | $18,110 |
| Standard Deviation (Sample) | $17,545 | $14,468 |
| Standard Deviation (Population) | $17,391 | $14,345 |
Similar Demographics by Median Household Income
Demographics Similar to Yugoslavians by Median Household Income
In terms of median household income, the demographic groups most similar to Yugoslavians are Vietnamese ($82,248, a difference of 0.070%), Panamanian ($82,272, a difference of 0.10%), Ecuadorian ($82,070, a difference of 0.14%), White/Caucasian ($82,029, a difference of 0.19%), and Nepalese ($82,410, a difference of 0.27%).
| Demographics | Rating | Rank | Median Household Income |
| Immigrants | Iraq | 16.7 /100 | #209 | Poor $82,594 |
| Immigrants | Uruguay | 16.4 /100 | #210 | Poor $82,560 |
| Salvadorans | 15.4 /100 | #211 | Poor $82,449 |
| Venezuelans | 15.3 /100 | #212 | Poor $82,432 |
| Nepalese | 15.1 /100 | #213 | Poor $82,410 |
| Panamanians | 14.0 /100 | #214 | Poor $82,272 |
| Vietnamese | 13.8 /100 | #215 | Poor $82,248 |
| Yugoslavians | 13.3 /100 | #216 | Poor $82,186 |
| Ecuadorians | 12.5 /100 | #217 | Poor $82,070 |
| Whites/Caucasians | 12.2 /100 | #218 | Poor $82,029 |
| Nigerians | 10.3 /100 | #219 | Poor $81,725 |
| Immigrants | Venezuela | 9.0 /100 | #220 | Tragic $81,506 |
| Immigrants | Ghana | 9.0 /100 | #221 | Tragic $81,489 |
| Immigrants | Nigeria | 7.7 /100 | #222 | Tragic $81,236 |
| Immigrants | El Salvador | 7.6 /100 | #223 | Tragic $81,213 |
Demographics Similar to Welsh by Median Household Income
In terms of median household income, the demographic groups most similar to Welsh are Finnish ($83,607, a difference of 0.030%), Ghanaian ($83,582, a difference of 0.060%), Immigrants from Armenia ($83,555, a difference of 0.090%), Iraqi ($83,753, a difference of 0.15%), and French ($83,468, a difference of 0.19%).
| Demographics | Rating | Rank | Median Household Income |
| Kenyans | 34.2 /100 | #185 | Fair $84,085 |
| Puget Sound Salish | 33.2 /100 | #186 | Fair $84,011 |
| Belgians | 33.2 /100 | #187 | Fair $84,008 |
| Tlingit-Haida | 32.6 /100 | #188 | Fair $83,968 |
| Immigrants | Colombia | 31.7 /100 | #189 | Fair $83,902 |
| Slovaks | 30.2 /100 | #190 | Fair $83,798 |
| Iraqis | 29.6 /100 | #191 | Fair $83,753 |
| Welsh | 28.0 /100 | #192 | Fair $83,628 |
| Finns | 27.7 /100 | #193 | Fair $83,607 |
| Ghanaians | 27.4 /100 | #194 | Fair $83,582 |
| Immigrants | Armenia | 27.0 /100 | #195 | Fair $83,555 |
| French | 26.0 /100 | #196 | Fair $83,468 |
| Aleuts | 25.7 /100 | #197 | Fair $83,446 |
| Japanese | 25.1 /100 | #198 | Fair $83,395 |
| Germans | 24.6 /100 | #199 | Fair $83,358 |