Yugoslavian vs Immigrants from Japan Median Household Income
COMPARE
Yugoslavian
Immigrants from Japan
Median Household Income
Median Household Income Comparison
Yugoslavians
Immigrants from Japan
$82,186
MEDIAN HOUSEHOLD INCOME
13.3/ 100
METRIC RATING
216th/ 347
METRIC RANK
$100,711
MEDIAN HOUSEHOLD INCOME
100.0/ 100
METRIC RATING
24th/ 347
METRIC RANK
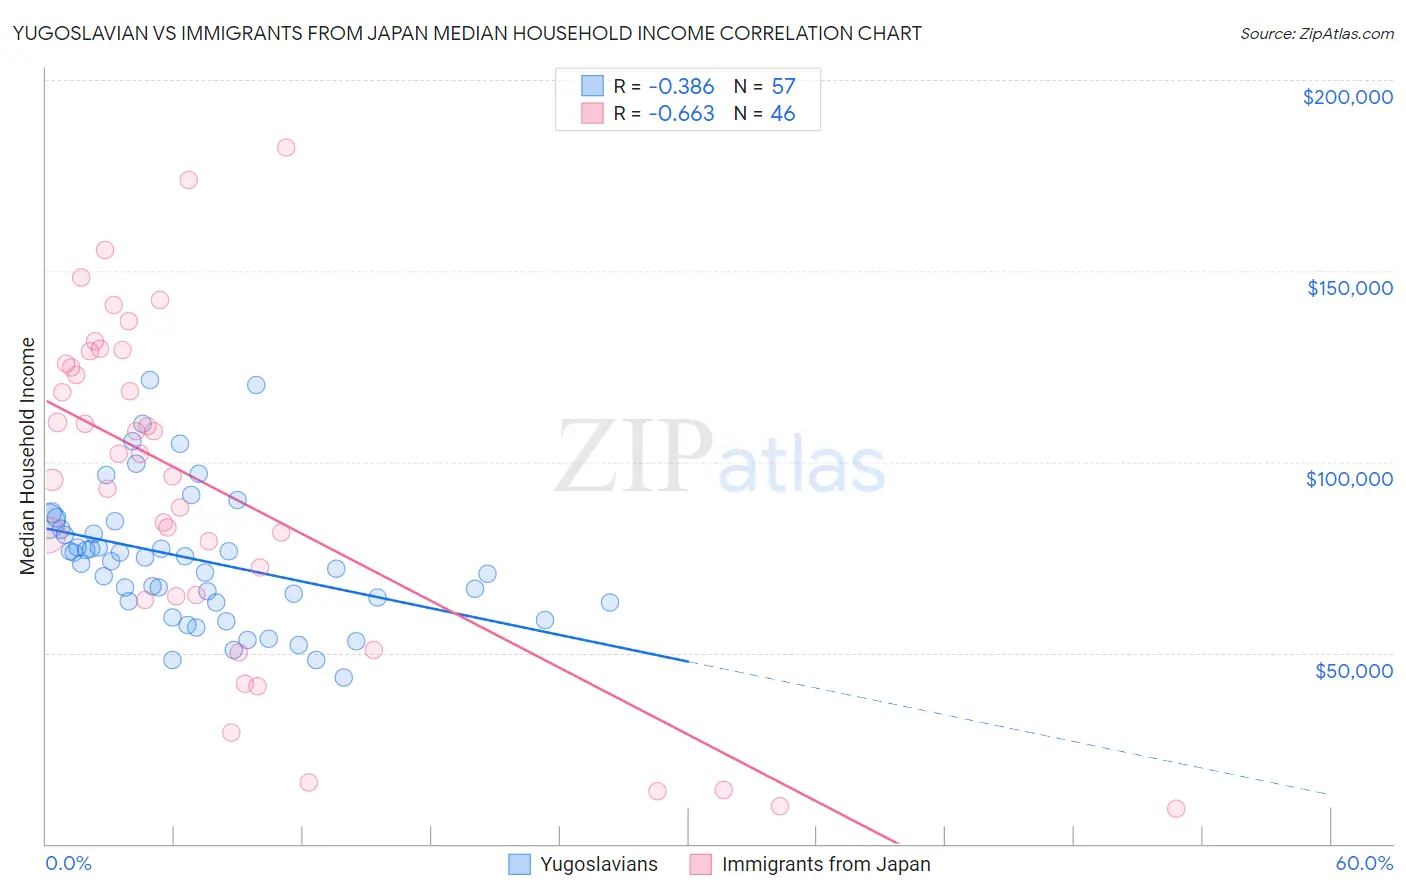
Yugoslavian vs Immigrants from Japan Median Household Income Correlation Chart
The statistical analysis conducted on geographies consisting of 285,592,338 people shows a mild negative correlation between the proportion of Yugoslavians and median household income in the United States with a correlation coefficient (R) of -0.386 and weighted average of $82,186. Similarly, the statistical analysis conducted on geographies consisting of 339,951,010 people shows a significant negative correlation between the proportion of Immigrants from Japan and median household income in the United States with a correlation coefficient (R) of -0.663 and weighted average of $100,711, a difference of 22.5%.
Median Household Income Correlation Summary
| Measurement | Yugoslavian | Immigrants from Japan |
| Minimum | $43,409 | $9,145 |
| Maximum | $121,486 | $182,188 |
| Range | $78,077 | $173,043 |
| Mean | $74,414 | $93,083 |
| Median | $74,058 | $99,144 |
| Interquartile 25% (IQ1) | $63,141 | $64,688 |
| Interquartile 75% (IQ3) | $83,356 | $125,805 |
| Interquartile Range (IQR) | $20,215 | $61,117 |
| Standard Deviation (Sample) | $17,545 | $44,275 |
| Standard Deviation (Population) | $17,391 | $43,791 |
Similar Demographics by Median Household Income
Demographics Similar to Yugoslavians by Median Household Income
In terms of median household income, the demographic groups most similar to Yugoslavians are Vietnamese ($82,248, a difference of 0.070%), Panamanian ($82,272, a difference of 0.10%), Ecuadorian ($82,070, a difference of 0.14%), White/Caucasian ($82,029, a difference of 0.19%), and Nepalese ($82,410, a difference of 0.27%).
| Demographics | Rating | Rank | Median Household Income |
| Immigrants | Iraq | 16.7 /100 | #209 | Poor $82,594 |
| Immigrants | Uruguay | 16.4 /100 | #210 | Poor $82,560 |
| Salvadorans | 15.4 /100 | #211 | Poor $82,449 |
| Venezuelans | 15.3 /100 | #212 | Poor $82,432 |
| Nepalese | 15.1 /100 | #213 | Poor $82,410 |
| Panamanians | 14.0 /100 | #214 | Poor $82,272 |
| Vietnamese | 13.8 /100 | #215 | Poor $82,248 |
| Yugoslavians | 13.3 /100 | #216 | Poor $82,186 |
| Ecuadorians | 12.5 /100 | #217 | Poor $82,070 |
| Whites/Caucasians | 12.2 /100 | #218 | Poor $82,029 |
| Nigerians | 10.3 /100 | #219 | Poor $81,725 |
| Immigrants | Venezuela | 9.0 /100 | #220 | Tragic $81,506 |
| Immigrants | Ghana | 9.0 /100 | #221 | Tragic $81,489 |
| Immigrants | Nigeria | 7.7 /100 | #222 | Tragic $81,236 |
| Immigrants | El Salvador | 7.6 /100 | #223 | Tragic $81,213 |
Demographics Similar to Immigrants from Japan by Median Household Income
In terms of median household income, the demographic groups most similar to Immigrants from Japan are Immigrants from Sweden ($100,699, a difference of 0.010%), Immigrants from Belgium ($100,306, a difference of 0.40%), Bhutanese ($100,151, a difference of 0.56%), Immigrants from Bolivia ($101,394, a difference of 0.68%), and Immigrants from Sri Lanka ($99,943, a difference of 0.77%).
| Demographics | Rating | Rank | Median Household Income |
| Immigrants | Korea | 100.0 /100 | #17 | Exceptional $102,962 |
| Cypriots | 100.0 /100 | #18 | Exceptional $102,843 |
| Immigrants | Australia | 100.0 /100 | #19 | Exceptional $102,562 |
| Bolivians | 100.0 /100 | #20 | Exceptional $102,195 |
| Eastern Europeans | 100.0 /100 | #21 | Exceptional $101,781 |
| Asians | 100.0 /100 | #22 | Exceptional $101,681 |
| Immigrants | Bolivia | 100.0 /100 | #23 | Exceptional $101,394 |
| Immigrants | Japan | 100.0 /100 | #24 | Exceptional $100,711 |
| Immigrants | Sweden | 100.0 /100 | #25 | Exceptional $100,699 |
| Immigrants | Belgium | 100.0 /100 | #26 | Exceptional $100,306 |
| Bhutanese | 100.0 /100 | #27 | Exceptional $100,151 |
| Immigrants | Sri Lanka | 100.0 /100 | #28 | Exceptional $99,943 |
| Immigrants | Asia | 100.0 /100 | #29 | Exceptional $99,933 |
| Immigrants | Northern Europe | 100.0 /100 | #30 | Exceptional $99,813 |
| Turks | 100.0 /100 | #31 | Exceptional $99,389 |