Yakama vs Eastern European Median Household Income
COMPARE
Yakama
Eastern European
Median Household Income
Median Household Income Comparison
Yakama
Eastern Europeans
$72,225
MEDIAN HOUSEHOLD INCOME
0.0/ 100
METRIC RATING
308th/ 347
METRIC RANK
$101,781
MEDIAN HOUSEHOLD INCOME
100.0/ 100
METRIC RATING
21st/ 347
METRIC RANK
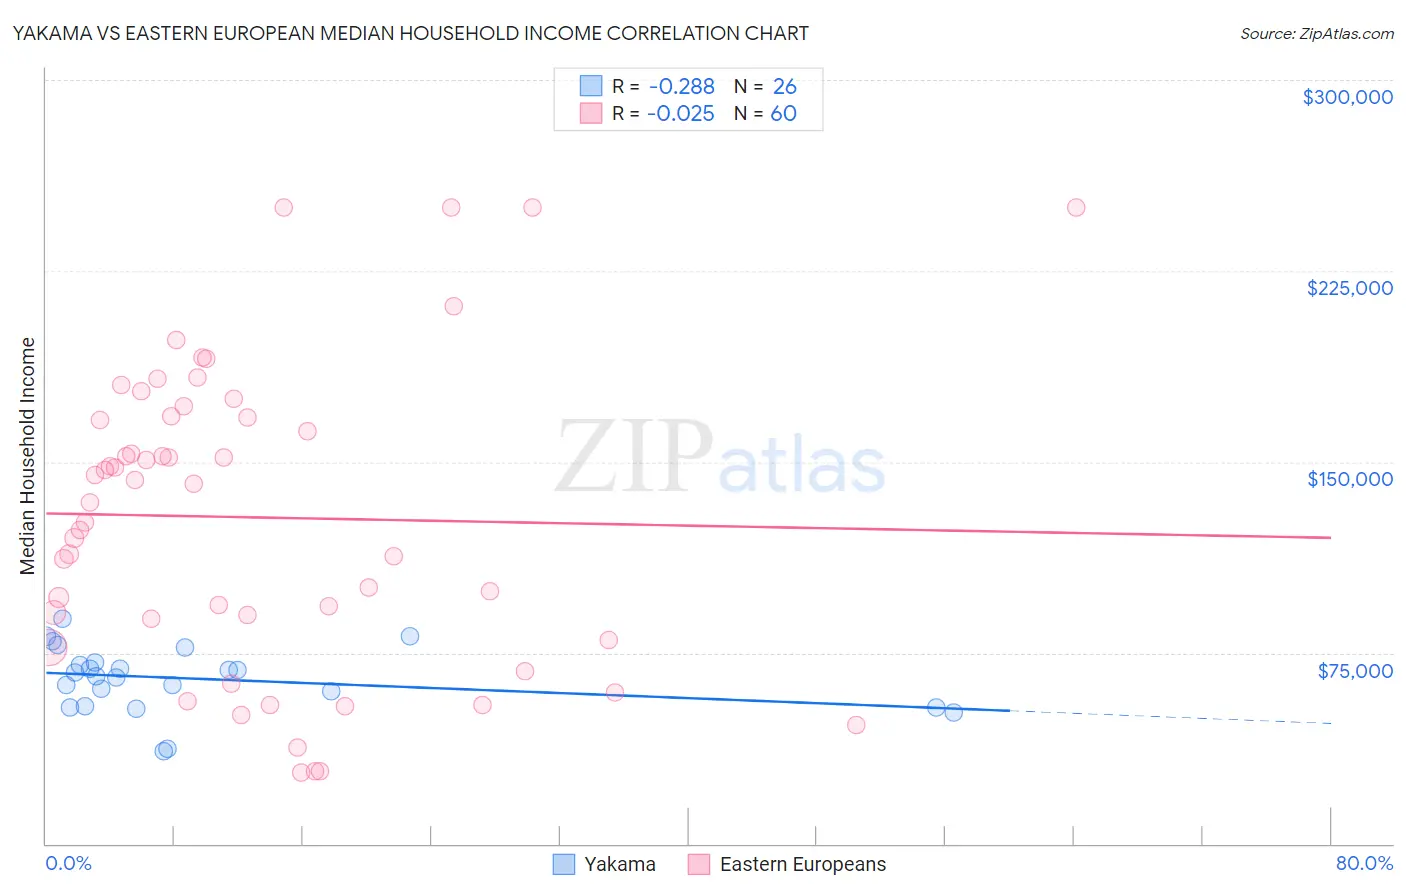
Yakama vs Eastern European Median Household Income Correlation Chart
The statistical analysis conducted on geographies consisting of 19,909,650 people shows a weak negative correlation between the proportion of Yakama and median household income in the United States with a correlation coefficient (R) of -0.288 and weighted average of $72,225. Similarly, the statistical analysis conducted on geographies consisting of 460,842,192 people shows no correlation between the proportion of Eastern Europeans and median household income in the United States with a correlation coefficient (R) of -0.025 and weighted average of $101,781, a difference of 40.9%.
Median Household Income Correlation Summary
| Measurement | Yakama | Eastern European |
| Minimum | $36,563 | $28,140 |
| Maximum | $88,202 | $250,001 |
| Range | $51,639 | $221,861 |
| Mean | $64,818 | $128,179 |
| Median | $66,477 | $137,749 |
| Interquartile 25% (IQ1) | $54,107 | $84,285 |
| Interquartile 75% (IQ3) | $71,429 | $167,660 |
| Interquartile Range (IQR) | $17,322 | $83,375 |
| Standard Deviation (Sample) | $12,734 | $58,971 |
| Standard Deviation (Population) | $12,487 | $58,477 |
Similar Demographics by Median Household Income
Demographics Similar to Yakama by Median Household Income
In terms of median household income, the demographic groups most similar to Yakama are Ute ($72,402, a difference of 0.25%), Potawatomi ($72,576, a difference of 0.49%), Honduran ($72,588, a difference of 0.50%), Immigrants from Caribbean ($71,860, a difference of 0.51%), and Immigrants from Haiti ($72,599, a difference of 0.52%).
| Demographics | Rating | Rank | Median Household Income |
| Cherokee | 0.0 /100 | #301 | Tragic $72,682 |
| Shoshone | 0.0 /100 | #302 | Tragic $72,660 |
| Africans | 0.0 /100 | #303 | Tragic $72,650 |
| Immigrants | Haiti | 0.0 /100 | #304 | Tragic $72,599 |
| Hondurans | 0.0 /100 | #305 | Tragic $72,588 |
| Potawatomi | 0.0 /100 | #306 | Tragic $72,576 |
| Ute | 0.0 /100 | #307 | Tragic $72,402 |
| Yakama | 0.0 /100 | #308 | Tragic $72,225 |
| Immigrants | Caribbean | 0.0 /100 | #309 | Tragic $71,860 |
| U.S. Virgin Islanders | 0.0 /100 | #310 | Tragic $71,853 |
| Immigrants | Zaire | 0.0 /100 | #311 | Tragic $71,801 |
| Immigrants | Honduras | 0.0 /100 | #312 | Tragic $71,452 |
| Immigrants | Bahamas | 0.0 /100 | #313 | Tragic $71,349 |
| Dominicans | 0.0 /100 | #314 | Tragic $71,302 |
| Ottawa | 0.0 /100 | #315 | Tragic $70,984 |
Demographics Similar to Eastern Europeans by Median Household Income
In terms of median household income, the demographic groups most similar to Eastern Europeans are Asian ($101,681, a difference of 0.10%), Immigrants from Bolivia ($101,394, a difference of 0.38%), Bolivian ($102,195, a difference of 0.41%), Immigrants from Australia ($102,562, a difference of 0.77%), and Cypriot ($102,843, a difference of 1.0%).
| Demographics | Rating | Rank | Median Household Income |
| Immigrants | Ireland | 100.0 /100 | #14 | Exceptional $104,692 |
| Immigrants | Israel | 100.0 /100 | #15 | Exceptional $104,090 |
| Burmese | 100.0 /100 | #16 | Exceptional $103,145 |
| Immigrants | Korea | 100.0 /100 | #17 | Exceptional $102,962 |
| Cypriots | 100.0 /100 | #18 | Exceptional $102,843 |
| Immigrants | Australia | 100.0 /100 | #19 | Exceptional $102,562 |
| Bolivians | 100.0 /100 | #20 | Exceptional $102,195 |
| Eastern Europeans | 100.0 /100 | #21 | Exceptional $101,781 |
| Asians | 100.0 /100 | #22 | Exceptional $101,681 |
| Immigrants | Bolivia | 100.0 /100 | #23 | Exceptional $101,394 |
| Immigrants | Japan | 100.0 /100 | #24 | Exceptional $100,711 |
| Immigrants | Sweden | 100.0 /100 | #25 | Exceptional $100,699 |
| Immigrants | Belgium | 100.0 /100 | #26 | Exceptional $100,306 |
| Bhutanese | 100.0 /100 | #27 | Exceptional $100,151 |
| Immigrants | Sri Lanka | 100.0 /100 | #28 | Exceptional $99,943 |