Yakama vs Immigrants from Eastern Europe Median Household Income
COMPARE
Yakama
Immigrants from Eastern Europe
Median Household Income
Median Household Income Comparison
Yakama
Immigrants from Eastern Europe
$72,225
MEDIAN HOUSEHOLD INCOME
0.0/ 100
METRIC RATING
308th/ 347
METRIC RANK
$93,051
MEDIAN HOUSEHOLD INCOME
99.4/ 100
METRIC RATING
81st/ 347
METRIC RANK
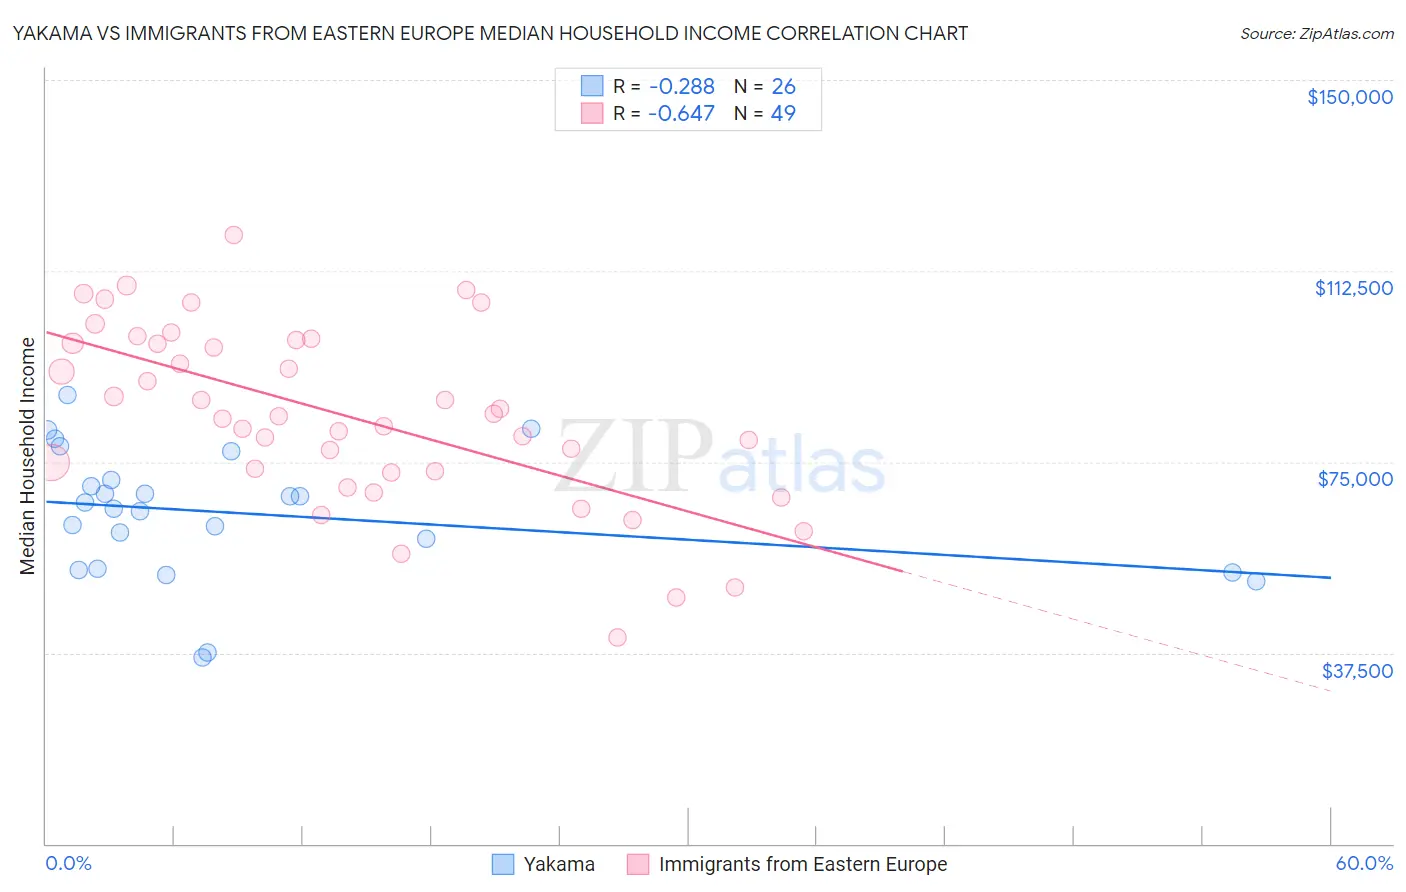
Yakama vs Immigrants from Eastern Europe Median Household Income Correlation Chart
The statistical analysis conducted on geographies consisting of 19,909,650 people shows a weak negative correlation between the proportion of Yakama and median household income in the United States with a correlation coefficient (R) of -0.288 and weighted average of $72,225. Similarly, the statistical analysis conducted on geographies consisting of 475,370,046 people shows a significant negative correlation between the proportion of Immigrants from Eastern Europe and median household income in the United States with a correlation coefficient (R) of -0.647 and weighted average of $93,051, a difference of 28.8%.
Median Household Income Correlation Summary
| Measurement | Yakama | Immigrants from Eastern Europe |
| Minimum | $36,563 | $40,467 |
| Maximum | $88,202 | $119,517 |
| Range | $51,639 | $79,050 |
| Mean | $64,818 | $84,121 |
| Median | $66,477 | $83,863 |
| Interquartile 25% (IQ1) | $54,107 | $72,994 |
| Interquartile 75% (IQ3) | $71,429 | $98,652 |
| Interquartile Range (IQR) | $17,322 | $25,658 |
| Standard Deviation (Sample) | $12,734 | $17,573 |
| Standard Deviation (Population) | $12,487 | $17,393 |
Similar Demographics by Median Household Income
Demographics Similar to Yakama by Median Household Income
In terms of median household income, the demographic groups most similar to Yakama are Ute ($72,402, a difference of 0.25%), Potawatomi ($72,576, a difference of 0.49%), Honduran ($72,588, a difference of 0.50%), Immigrants from Caribbean ($71,860, a difference of 0.51%), and Immigrants from Haiti ($72,599, a difference of 0.52%).
| Demographics | Rating | Rank | Median Household Income |
| Cherokee | 0.0 /100 | #301 | Tragic $72,682 |
| Shoshone | 0.0 /100 | #302 | Tragic $72,660 |
| Africans | 0.0 /100 | #303 | Tragic $72,650 |
| Immigrants | Haiti | 0.0 /100 | #304 | Tragic $72,599 |
| Hondurans | 0.0 /100 | #305 | Tragic $72,588 |
| Potawatomi | 0.0 /100 | #306 | Tragic $72,576 |
| Ute | 0.0 /100 | #307 | Tragic $72,402 |
| Yakama | 0.0 /100 | #308 | Tragic $72,225 |
| Immigrants | Caribbean | 0.0 /100 | #309 | Tragic $71,860 |
| U.S. Virgin Islanders | 0.0 /100 | #310 | Tragic $71,853 |
| Immigrants | Zaire | 0.0 /100 | #311 | Tragic $71,801 |
| Immigrants | Honduras | 0.0 /100 | #312 | Tragic $71,452 |
| Immigrants | Bahamas | 0.0 /100 | #313 | Tragic $71,349 |
| Dominicans | 0.0 /100 | #314 | Tragic $71,302 |
| Ottawa | 0.0 /100 | #315 | Tragic $70,984 |
Demographics Similar to Immigrants from Eastern Europe by Median Household Income
In terms of median household income, the demographic groups most similar to Immigrants from Eastern Europe are Tongan ($93,076, a difference of 0.030%), Sri Lankan ($93,093, a difference of 0.050%), Immigrants from Bulgaria ($93,148, a difference of 0.10%), Immigrants from Spain ($92,732, a difference of 0.34%), and South African ($93,379, a difference of 0.35%).
| Demographics | Rating | Rank | Median Household Income |
| Immigrants | Latvia | 99.6 /100 | #74 | Exceptional $93,602 |
| Immigrants | Italy | 99.5 /100 | #75 | Exceptional $93,465 |
| South Africans | 99.5 /100 | #76 | Exceptional $93,379 |
| Immigrants | Afghanistan | 99.5 /100 | #77 | Exceptional $93,375 |
| Immigrants | Bulgaria | 99.4 /100 | #78 | Exceptional $93,148 |
| Sri Lankans | 99.4 /100 | #79 | Exceptional $93,093 |
| Tongans | 99.4 /100 | #80 | Exceptional $93,076 |
| Immigrants | Eastern Europe | 99.4 /100 | #81 | Exceptional $93,051 |
| Immigrants | Spain | 99.3 /100 | #82 | Exceptional $92,732 |
| Italians | 99.1 /100 | #83 | Exceptional $92,475 |
| Immigrants | Argentina | 99.1 /100 | #84 | Exceptional $92,417 |
| Immigrants | Croatia | 99.0 /100 | #85 | Exceptional $92,225 |
| Immigrants | England | 98.9 /100 | #86 | Exceptional $92,098 |
| Immigrants | Hungary | 98.9 /100 | #87 | Exceptional $92,094 |
| Immigrants | Canada | 98.8 /100 | #88 | Exceptional $92,029 |