Yakama vs Immigrants from Germany Median Household Income
COMPARE
Yakama
Immigrants from Germany
Median Household Income
Median Household Income Comparison
Yakama
Immigrants from Germany
$72,225
MEDIAN HOUSEHOLD INCOME
0.0/ 100
METRIC RATING
308th/ 347
METRIC RANK
$86,764
MEDIAN HOUSEHOLD INCOME
74.4/ 100
METRIC RATING
154th/ 347
METRIC RANK
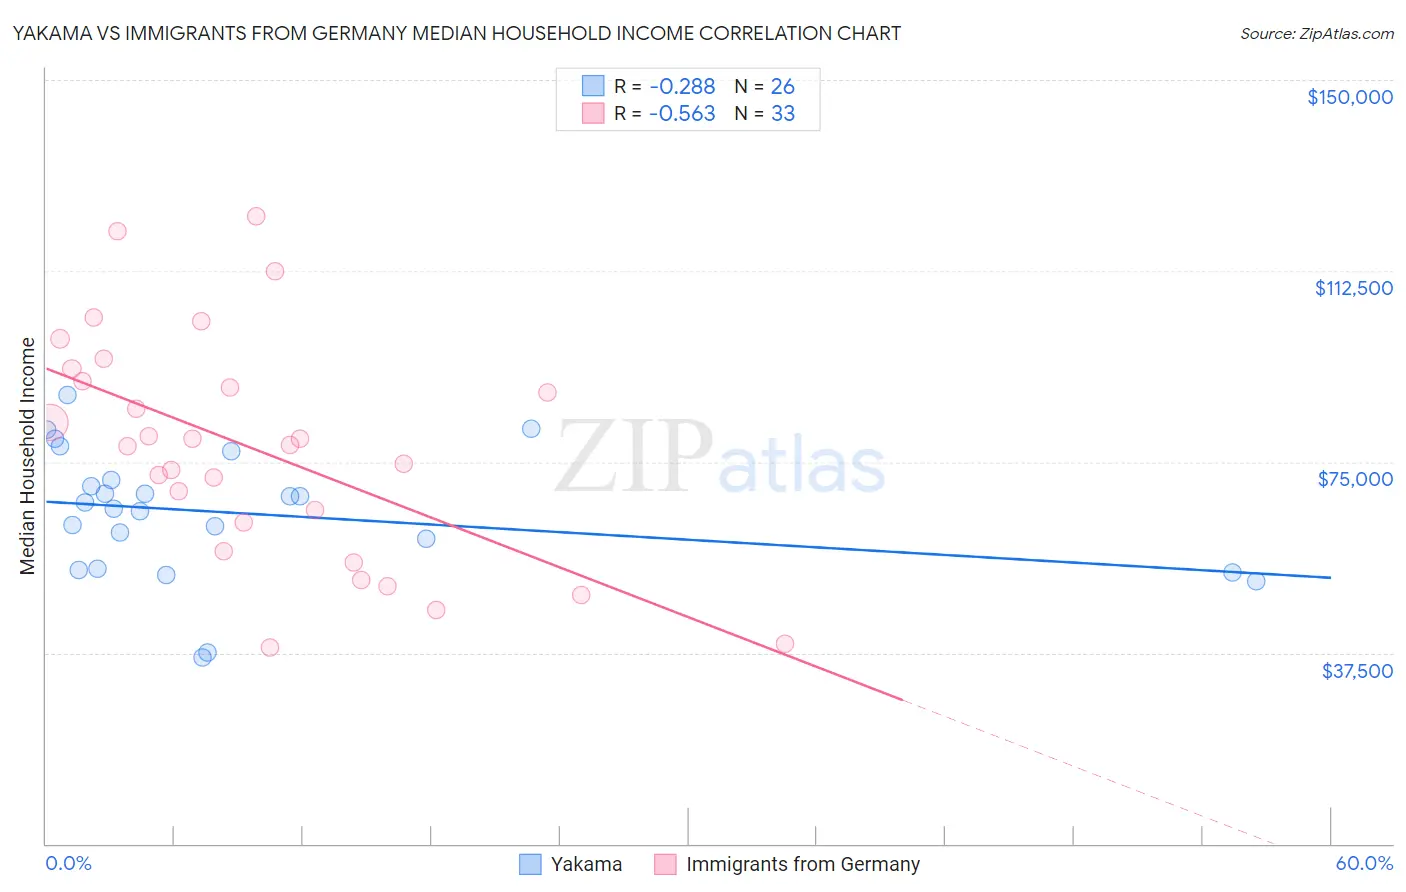
Yakama vs Immigrants from Germany Median Household Income Correlation Chart
The statistical analysis conducted on geographies consisting of 19,909,650 people shows a weak negative correlation between the proportion of Yakama and median household income in the United States with a correlation coefficient (R) of -0.288 and weighted average of $72,225. Similarly, the statistical analysis conducted on geographies consisting of 463,670,643 people shows a substantial negative correlation between the proportion of Immigrants from Germany and median household income in the United States with a correlation coefficient (R) of -0.563 and weighted average of $86,764, a difference of 20.1%.
Median Household Income Correlation Summary
| Measurement | Yakama | Immigrants from Germany |
| Minimum | $36,563 | $38,452 |
| Maximum | $88,202 | $123,192 |
| Range | $51,639 | $84,740 |
| Mean | $64,818 | $77,580 |
| Median | $66,477 | $78,375 |
| Interquartile 25% (IQ1) | $54,107 | $60,226 |
| Interquartile 75% (IQ3) | $71,429 | $92,055 |
| Interquartile Range (IQR) | $17,322 | $31,829 |
| Standard Deviation (Sample) | $12,734 | $22,106 |
| Standard Deviation (Population) | $12,487 | $21,769 |
Similar Demographics by Median Household Income
Demographics Similar to Yakama by Median Household Income
In terms of median household income, the demographic groups most similar to Yakama are Ute ($72,402, a difference of 0.25%), Potawatomi ($72,576, a difference of 0.49%), Honduran ($72,588, a difference of 0.50%), Immigrants from Caribbean ($71,860, a difference of 0.51%), and Immigrants from Haiti ($72,599, a difference of 0.52%).
| Demographics | Rating | Rank | Median Household Income |
| Cherokee | 0.0 /100 | #301 | Tragic $72,682 |
| Shoshone | 0.0 /100 | #302 | Tragic $72,660 |
| Africans | 0.0 /100 | #303 | Tragic $72,650 |
| Immigrants | Haiti | 0.0 /100 | #304 | Tragic $72,599 |
| Hondurans | 0.0 /100 | #305 | Tragic $72,588 |
| Potawatomi | 0.0 /100 | #306 | Tragic $72,576 |
| Ute | 0.0 /100 | #307 | Tragic $72,402 |
| Yakama | 0.0 /100 | #308 | Tragic $72,225 |
| Immigrants | Caribbean | 0.0 /100 | #309 | Tragic $71,860 |
| U.S. Virgin Islanders | 0.0 /100 | #310 | Tragic $71,853 |
| Immigrants | Zaire | 0.0 /100 | #311 | Tragic $71,801 |
| Immigrants | Honduras | 0.0 /100 | #312 | Tragic $71,452 |
| Immigrants | Bahamas | 0.0 /100 | #313 | Tragic $71,349 |
| Dominicans | 0.0 /100 | #314 | Tragic $71,302 |
| Ottawa | 0.0 /100 | #315 | Tragic $70,984 |
Demographics Similar to Immigrants from Germany by Median Household Income
In terms of median household income, the demographic groups most similar to Immigrants from Germany are South American ($86,824, a difference of 0.070%), Immigrants from Saudi Arabia ($86,875, a difference of 0.13%), Carpatho Rusyn ($86,635, a difference of 0.15%), Hungarian ($86,920, a difference of 0.18%), and Basque ($87,001, a difference of 0.27%).
| Demographics | Rating | Rank | Median Household Income |
| South American Indians | 81.8 /100 | #147 | Excellent $87,446 |
| Costa Ricans | 80.0 /100 | #148 | Excellent $87,262 |
| Immigrants | Nepal | 77.7 /100 | #149 | Good $87,046 |
| Basques | 77.2 /100 | #150 | Good $87,001 |
| Hungarians | 76.3 /100 | #151 | Good $86,920 |
| Immigrants | Saudi Arabia | 75.8 /100 | #152 | Good $86,875 |
| South Americans | 75.1 /100 | #153 | Good $86,824 |
| Immigrants | Germany | 74.4 /100 | #154 | Good $86,764 |
| Carpatho Rusyns | 72.8 /100 | #155 | Good $86,635 |
| Immigrants | Albania | 71.5 /100 | #156 | Good $86,534 |
| Samoans | 71.0 /100 | #157 | Good $86,498 |
| Moroccans | 70.6 /100 | #158 | Good $86,468 |
| Immigrants | Uzbekistan | 70.1 /100 | #159 | Good $86,425 |
| Luxembourgers | 70.0 /100 | #160 | Good $86,418 |
| Slavs | 69.7 /100 | #161 | Good $86,398 |