Yakama vs Spanish American Indian Median Household Income
COMPARE
Yakama
Spanish American Indian
Median Household Income
Median Household Income Comparison
Yakama
Spanish American Indians
$72,225
MEDIAN HOUSEHOLD INCOME
0.0/ 100
METRIC RATING
308th/ 347
METRIC RANK
$76,670
MEDIAN HOUSEHOLD INCOME
0.4/ 100
METRIC RATING
259th/ 347
METRIC RANK
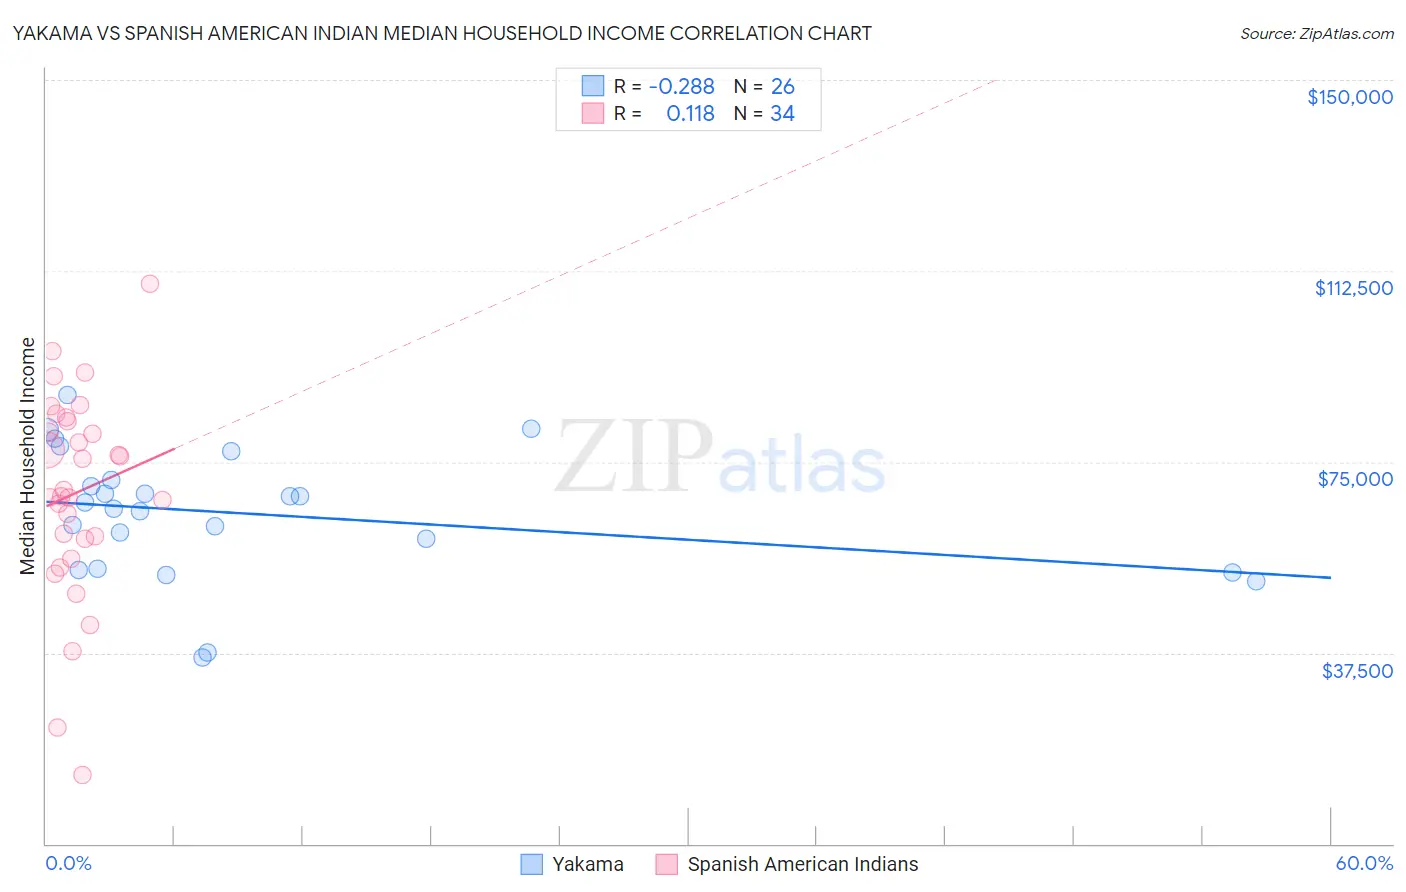
Yakama vs Spanish American Indian Median Household Income Correlation Chart
The statistical analysis conducted on geographies consisting of 19,909,650 people shows a weak negative correlation between the proportion of Yakama and median household income in the United States with a correlation coefficient (R) of -0.288 and weighted average of $72,225. Similarly, the statistical analysis conducted on geographies consisting of 73,142,507 people shows a poor positive correlation between the proportion of Spanish American Indians and median household income in the United States with a correlation coefficient (R) of 0.118 and weighted average of $76,670, a difference of 6.1%.
Median Household Income Correlation Summary
| Measurement | Yakama | Spanish American Indian |
| Minimum | $36,563 | $13,474 |
| Maximum | $88,202 | $110,000 |
| Range | $51,639 | $96,526 |
| Mean | $64,818 | $68,921 |
| Median | $66,477 | $68,901 |
| Interquartile 25% (IQ1) | $54,107 | $59,929 |
| Interquartile 75% (IQ3) | $71,429 | $82,889 |
| Interquartile Range (IQR) | $17,322 | $22,960 |
| Standard Deviation (Sample) | $12,734 | $20,226 |
| Standard Deviation (Population) | $12,487 | $19,926 |
Similar Demographics by Median Household Income
Demographics Similar to Yakama by Median Household Income
In terms of median household income, the demographic groups most similar to Yakama are Ute ($72,402, a difference of 0.25%), Potawatomi ($72,576, a difference of 0.49%), Honduran ($72,588, a difference of 0.50%), Immigrants from Caribbean ($71,860, a difference of 0.51%), and Immigrants from Haiti ($72,599, a difference of 0.52%).
| Demographics | Rating | Rank | Median Household Income |
| Cherokee | 0.0 /100 | #301 | Tragic $72,682 |
| Shoshone | 0.0 /100 | #302 | Tragic $72,660 |
| Africans | 0.0 /100 | #303 | Tragic $72,650 |
| Immigrants | Haiti | 0.0 /100 | #304 | Tragic $72,599 |
| Hondurans | 0.0 /100 | #305 | Tragic $72,588 |
| Potawatomi | 0.0 /100 | #306 | Tragic $72,576 |
| Ute | 0.0 /100 | #307 | Tragic $72,402 |
| Yakama | 0.0 /100 | #308 | Tragic $72,225 |
| Immigrants | Caribbean | 0.0 /100 | #309 | Tragic $71,860 |
| U.S. Virgin Islanders | 0.0 /100 | #310 | Tragic $71,853 |
| Immigrants | Zaire | 0.0 /100 | #311 | Tragic $71,801 |
| Immigrants | Honduras | 0.0 /100 | #312 | Tragic $71,452 |
| Immigrants | Bahamas | 0.0 /100 | #313 | Tragic $71,349 |
| Dominicans | 0.0 /100 | #314 | Tragic $71,302 |
| Ottawa | 0.0 /100 | #315 | Tragic $70,984 |
Demographics Similar to Spanish American Indians by Median Household Income
In terms of median household income, the demographic groups most similar to Spanish American Indians are Jamaican ($76,583, a difference of 0.11%), Immigrants from Nicaragua ($76,784, a difference of 0.15%), Immigrants from Grenada ($76,517, a difference of 0.20%), Immigrants from Senegal ($76,915, a difference of 0.32%), and French American Indian ($76,387, a difference of 0.37%).
| Demographics | Rating | Rank | Median Household Income |
| Immigrants | West Indies | 1.0 /100 | #252 | Tragic $77,956 |
| Immigrants | St. Vincent and the Grenadines | 0.9 /100 | #253 | Tragic $77,690 |
| Sub-Saharan Africans | 0.8 /100 | #254 | Tragic $77,631 |
| Immigrants | Middle Africa | 0.8 /100 | #255 | Tragic $77,559 |
| Belizeans | 0.6 /100 | #256 | Tragic $77,028 |
| Immigrants | Senegal | 0.5 /100 | #257 | Tragic $76,915 |
| Immigrants | Nicaragua | 0.5 /100 | #258 | Tragic $76,784 |
| Spanish American Indians | 0.4 /100 | #259 | Tragic $76,670 |
| Jamaicans | 0.4 /100 | #260 | Tragic $76,583 |
| Immigrants | Grenada | 0.4 /100 | #261 | Tragic $76,517 |
| French American Indians | 0.4 /100 | #262 | Tragic $76,387 |
| Alaskan Athabascans | 0.4 /100 | #263 | Tragic $76,383 |
| Guatemalans | 0.3 /100 | #264 | Tragic $75,961 |
| Immigrants | Belize | 0.3 /100 | #265 | Tragic $75,938 |
| Americans | 0.3 /100 | #266 | Tragic $75,932 |