Yakama vs Norwegian Median Household Income
COMPARE
Yakama
Norwegian
Median Household Income
Median Household Income Comparison
Yakama
Norwegians
$72,225
MEDIAN HOUSEHOLD INCOME
0.0/ 100
METRIC RATING
308th/ 347
METRIC RANK
$86,084
MEDIAN HOUSEHOLD INCOME
65.3/ 100
METRIC RATING
165th/ 347
METRIC RANK
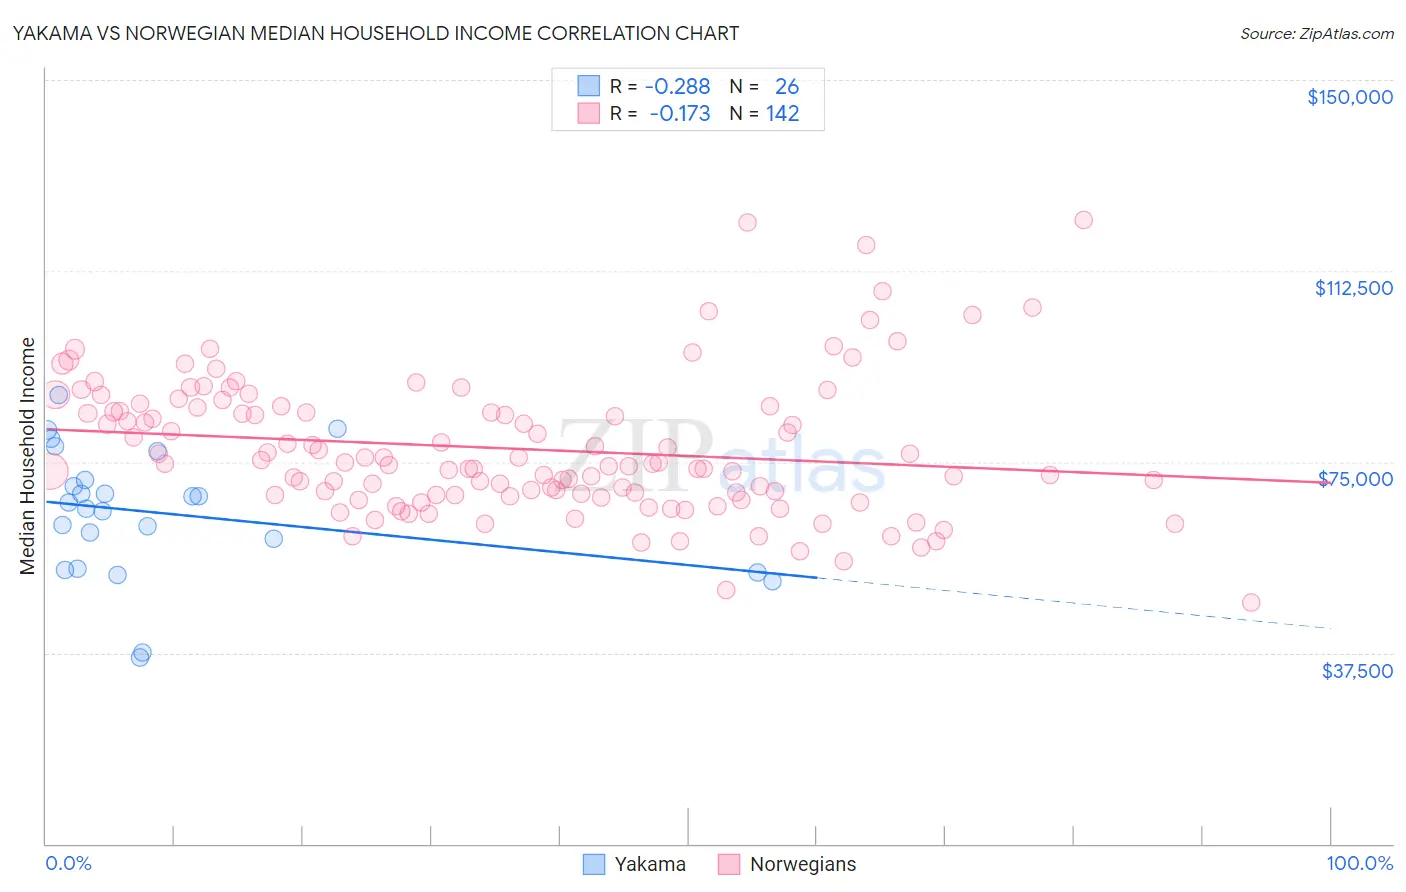
Yakama vs Norwegian Median Household Income Correlation Chart
The statistical analysis conducted on geographies consisting of 19,909,650 people shows a weak negative correlation between the proportion of Yakama and median household income in the United States with a correlation coefficient (R) of -0.288 and weighted average of $72,225. Similarly, the statistical analysis conducted on geographies consisting of 532,629,578 people shows a poor negative correlation between the proportion of Norwegians and median household income in the United States with a correlation coefficient (R) of -0.173 and weighted average of $86,084, a difference of 19.2%.
Median Household Income Correlation Summary
| Measurement | Yakama | Norwegian |
| Minimum | $36,563 | $47,500 |
| Maximum | $88,202 | $122,560 |
| Range | $51,639 | $75,060 |
| Mean | $64,818 | $77,577 |
| Median | $66,477 | $74,729 |
| Interquartile 25% (IQ1) | $54,107 | $68,461 |
| Interquartile 75% (IQ3) | $71,429 | $85,771 |
| Interquartile Range (IQR) | $17,322 | $17,310 |
| Standard Deviation (Sample) | $12,734 | $13,465 |
| Standard Deviation (Population) | $12,487 | $13,417 |
Similar Demographics by Median Household Income
Demographics Similar to Yakama by Median Household Income
In terms of median household income, the demographic groups most similar to Yakama are Ute ($72,402, a difference of 0.25%), Potawatomi ($72,576, a difference of 0.49%), Honduran ($72,588, a difference of 0.50%), Immigrants from Caribbean ($71,860, a difference of 0.51%), and Immigrants from Haiti ($72,599, a difference of 0.52%).
| Demographics | Rating | Rank | Median Household Income |
| Cherokee | 0.0 /100 | #301 | Tragic $72,682 |
| Shoshone | 0.0 /100 | #302 | Tragic $72,660 |
| Africans | 0.0 /100 | #303 | Tragic $72,650 |
| Immigrants | Haiti | 0.0 /100 | #304 | Tragic $72,599 |
| Hondurans | 0.0 /100 | #305 | Tragic $72,588 |
| Potawatomi | 0.0 /100 | #306 | Tragic $72,576 |
| Ute | 0.0 /100 | #307 | Tragic $72,402 |
| Yakama | 0.0 /100 | #308 | Tragic $72,225 |
| Immigrants | Caribbean | 0.0 /100 | #309 | Tragic $71,860 |
| U.S. Virgin Islanders | 0.0 /100 | #310 | Tragic $71,853 |
| Immigrants | Zaire | 0.0 /100 | #311 | Tragic $71,801 |
| Immigrants | Honduras | 0.0 /100 | #312 | Tragic $71,452 |
| Immigrants | Bahamas | 0.0 /100 | #313 | Tragic $71,349 |
| Dominicans | 0.0 /100 | #314 | Tragic $71,302 |
| Ottawa | 0.0 /100 | #315 | Tragic $70,984 |
Demographics Similar to Norwegians by Median Household Income
In terms of median household income, the demographic groups most similar to Norwegians are Scandinavian ($86,073, a difference of 0.010%), Irish ($86,145, a difference of 0.070%), Czech ($86,164, a difference of 0.090%), Guamanian/Chamorro ($86,255, a difference of 0.20%), and Immigrants ($85,818, a difference of 0.31%).
| Demographics | Rating | Rank | Median Household Income |
| Moroccans | 70.6 /100 | #158 | Good $86,468 |
| Immigrants | Uzbekistan | 70.1 /100 | #159 | Good $86,425 |
| Luxembourgers | 70.0 /100 | #160 | Good $86,418 |
| Slavs | 69.7 /100 | #161 | Good $86,398 |
| Guamanians/Chamorros | 67.7 /100 | #162 | Good $86,255 |
| Czechs | 66.4 /100 | #163 | Good $86,164 |
| Irish | 66.2 /100 | #164 | Good $86,145 |
| Norwegians | 65.3 /100 | #165 | Good $86,084 |
| Scandinavians | 65.1 /100 | #166 | Good $86,073 |
| Immigrants | Immigrants | 61.3 /100 | #167 | Good $85,818 |
| Icelanders | 61.0 /100 | #168 | Good $85,797 |
| Colombians | 59.7 /100 | #169 | Average $85,716 |
| Swiss | 59.2 /100 | #170 | Average $85,681 |
| Immigrants | South America | 58.1 /100 | #171 | Average $85,611 |
| Slovenes | 57.4 /100 | #172 | Average $85,562 |