Immigrants from Greece vs Scottish Per Capita Income
COMPARE
Immigrants from Greece
Scottish
Per Capita Income
Per Capita Income Comparison
Immigrants from Greece
Scottish
$51,891
PER CAPITA INCOME
100.0/ 100
METRIC RATING
36th/ 347
METRIC RANK
$44,440
PER CAPITA INCOME
70.6/ 100
METRIC RATING
153rd/ 347
METRIC RANK
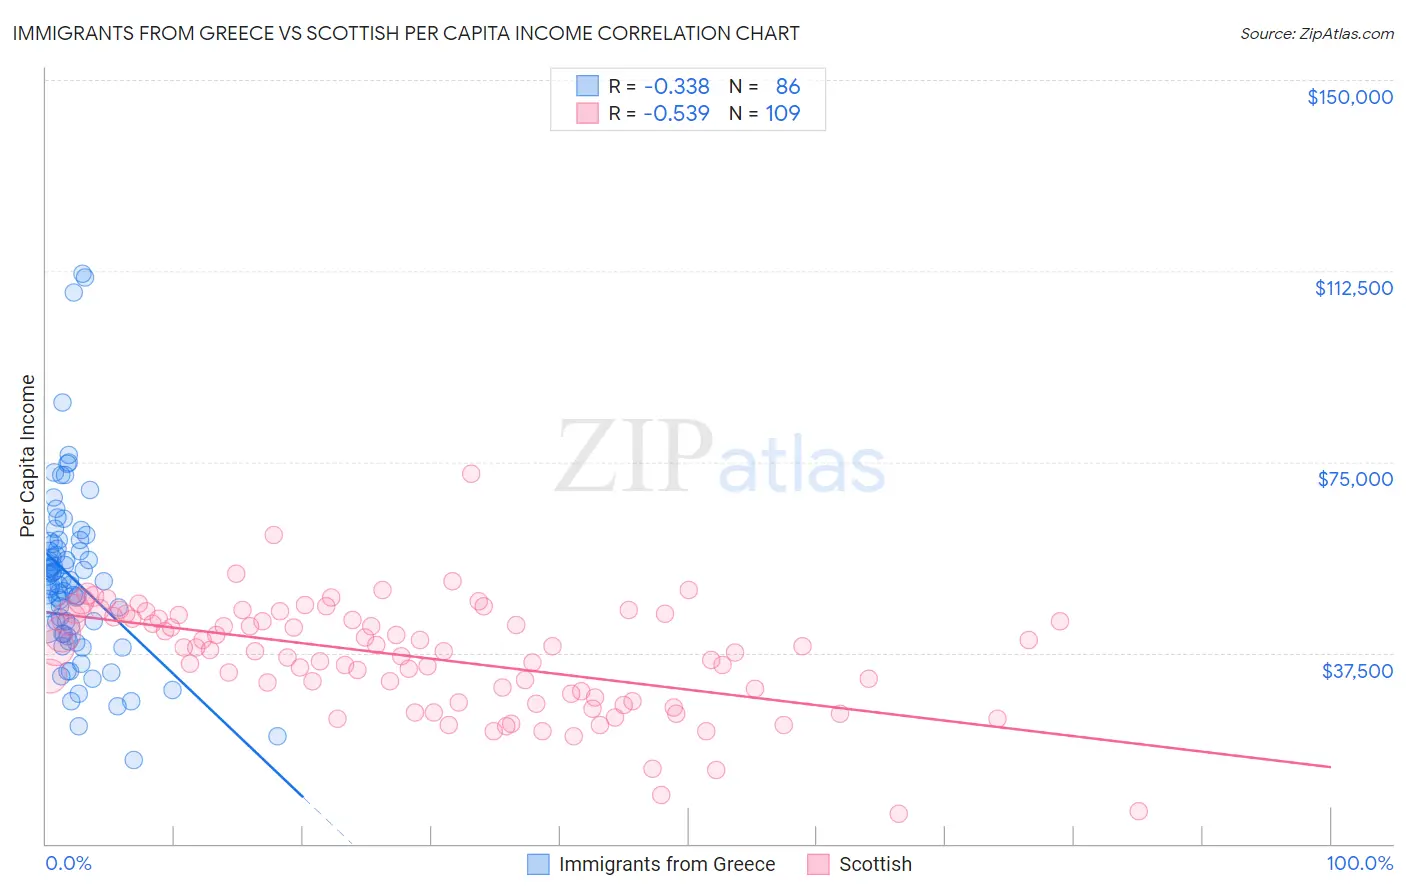
Immigrants from Greece vs Scottish Per Capita Income Correlation Chart
The statistical analysis conducted on geographies consisting of 216,879,011 people shows a mild negative correlation between the proportion of Immigrants from Greece and per capita income in the United States with a correlation coefficient (R) of -0.338 and weighted average of $51,891. Similarly, the statistical analysis conducted on geographies consisting of 567,196,152 people shows a substantial negative correlation between the proportion of Scottish and per capita income in the United States with a correlation coefficient (R) of -0.539 and weighted average of $44,440, a difference of 16.8%.
Per Capita Income Correlation Summary
| Measurement | Immigrants from Greece | Scottish |
| Minimum | $16,481 | $5,913 |
| Maximum | $111,988 | $72,790 |
| Range | $95,507 | $66,877 |
| Mean | $52,082 | $36,544 |
| Median | $51,208 | $37,961 |
| Interquartile 25% (IQ1) | $41,348 | $28,258 |
| Interquartile 75% (IQ3) | $58,850 | $44,399 |
| Interquartile Range (IQR) | $17,502 | $16,142 |
| Standard Deviation (Sample) | $17,408 | $10,868 |
| Standard Deviation (Population) | $17,307 | $10,818 |
Similar Demographics by Per Capita Income
Demographics Similar to Immigrants from Greece by Per Capita Income
In terms of per capita income, the demographic groups most similar to Immigrants from Greece are Estonian ($51,875, a difference of 0.030%), Burmese ($52,005, a difference of 0.22%), Immigrants from Czechoslovakia ($51,770, a difference of 0.23%), Immigrants from Russia ($52,044, a difference of 0.29%), and Cambodian ($51,731, a difference of 0.31%).
| Demographics | Rating | Rank | Per Capita Income |
| Israelis | 100.0 /100 | #29 | Exceptional $52,596 |
| Immigrants | Austria | 100.0 /100 | #30 | Exceptional $52,503 |
| Turks | 100.0 /100 | #31 | Exceptional $52,391 |
| Immigrants | Norway | 100.0 /100 | #32 | Exceptional $52,217 |
| Australians | 100.0 /100 | #33 | Exceptional $52,074 |
| Immigrants | Russia | 100.0 /100 | #34 | Exceptional $52,044 |
| Burmese | 100.0 /100 | #35 | Exceptional $52,005 |
| Immigrants | Greece | 100.0 /100 | #36 | Exceptional $51,891 |
| Estonians | 100.0 /100 | #37 | Exceptional $51,875 |
| Immigrants | Czechoslovakia | 100.0 /100 | #38 | Exceptional $51,770 |
| Cambodians | 100.0 /100 | #39 | Exceptional $51,731 |
| Immigrants | Korea | 100.0 /100 | #40 | Exceptional $51,671 |
| Immigrants | South Africa | 100.0 /100 | #41 | Exceptional $51,465 |
| Immigrants | Turkey | 100.0 /100 | #42 | Exceptional $51,368 |
| Immigrants | Lithuania | 100.0 /100 | #43 | Exceptional $51,361 |
Demographics Similar to Scottish by Per Capita Income
In terms of per capita income, the demographic groups most similar to Scottish are Norwegian ($44,480, a difference of 0.090%), Peruvian ($44,479, a difference of 0.090%), Immigrants from Eritrea ($44,509, a difference of 0.16%), Portuguese ($44,362, a difference of 0.18%), and Korean ($44,522, a difference of 0.19%).
| Demographics | Rating | Rank | Per Capita Income |
| Irish | 75.8 /100 | #146 | Good $44,679 |
| Czechs | 74.1 /100 | #147 | Good $44,595 |
| Immigrants | Armenia | 73.1 /100 | #148 | Good $44,552 |
| Koreans | 72.5 /100 | #149 | Good $44,522 |
| Immigrants | Eritrea | 72.1 /100 | #150 | Good $44,509 |
| Norwegians | 71.5 /100 | #151 | Good $44,480 |
| Peruvians | 71.5 /100 | #152 | Good $44,479 |
| Scottish | 70.6 /100 | #153 | Good $44,440 |
| Portuguese | 68.7 /100 | #154 | Good $44,362 |
| Uruguayans | 67.6 /100 | #155 | Good $44,318 |
| Slovaks | 65.4 /100 | #156 | Good $44,229 |
| South American Indians | 64.8 /100 | #157 | Good $44,206 |
| Immigrants | Nepal | 64.3 /100 | #158 | Good $44,187 |
| South Americans | 62.4 /100 | #159 | Good $44,114 |
| Danes | 61.9 /100 | #160 | Good $44,095 |