White/Caucasian vs Scottish 10th Grade
COMPARE
White/Caucasian
Scottish
10th Grade
10th Grade Comparison
Whites/Caucasians
Scottish
94.7%
10TH GRADE
98.8/ 100
METRIC RATING
91st/ 347
METRIC RANK
95.6%
10TH GRADE
100.0/ 100
METRIC RATING
16th/ 347
METRIC RANK
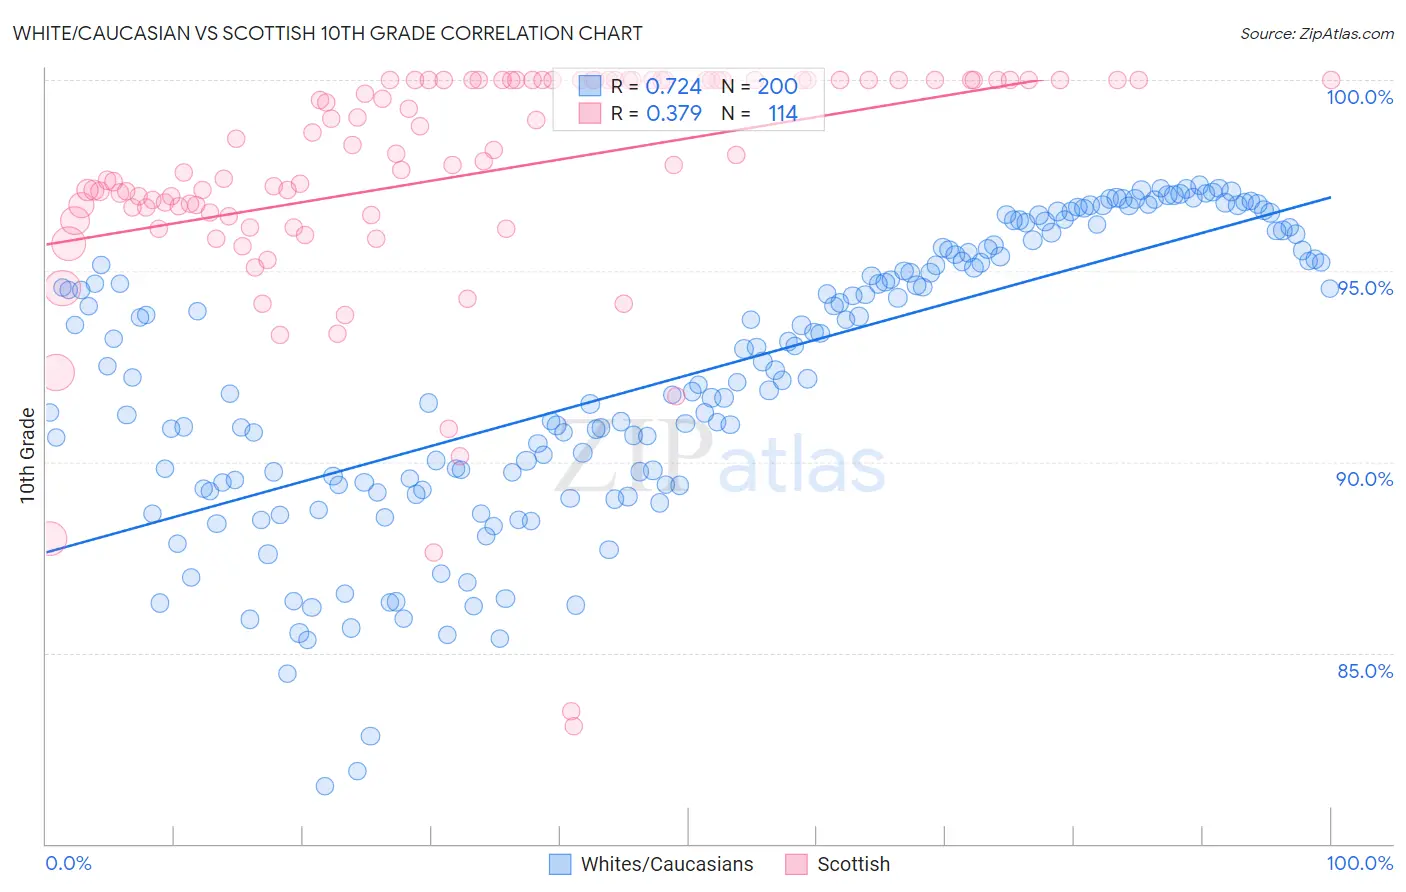
White/Caucasian vs Scottish 10th Grade Correlation Chart
The statistical analysis conducted on geographies consisting of 585,244,993 people shows a strong positive correlation between the proportion of Whites/Caucasians and percentage of population with at least 10th grade education in the United States with a correlation coefficient (R) of 0.724 and weighted average of 94.7%. Similarly, the statistical analysis conducted on geographies consisting of 567,140,525 people shows a mild positive correlation between the proportion of Scottish and percentage of population with at least 10th grade education in the United States with a correlation coefficient (R) of 0.379 and weighted average of 95.6%, a difference of 0.98%.
10th Grade Correlation Summary
| Measurement | White/Caucasian | Scottish |
| Minimum | 81.5% | 83.1% |
| Maximum | 97.2% | 100.0% |
| Range | 15.7% | 16.9% |
| Mean | 92.3% | 97.5% |
| Median | 92.6% | 97.9% |
| Interquartile 25% (IQ1) | 89.5% | 96.5% |
| Interquartile 75% (IQ3) | 95.5% | 100.0% |
| Interquartile Range (IQR) | 6.1% | 3.5% |
| Standard Deviation (Sample) | 3.7% | 3.2% |
| Standard Deviation (Population) | 3.7% | 3.2% |
Similar Demographics by 10th Grade
Demographics Similar to Whites/Caucasians by 10th Grade
In terms of 10th grade, the demographic groups most similar to Whites/Caucasians are South African (94.7%, a difference of 0.010%), Immigrants from Moldova (94.7%, a difference of 0.020%), Immigrants from Japan (94.7%, a difference of 0.030%), Immigrants from Saudi Arabia (94.7%, a difference of 0.040%), and Icelander (94.7%, a difference of 0.050%).
| Demographics | Rating | Rank | 10th Grade |
| Icelanders | 99.1 /100 | #84 | Exceptional 94.7% |
| Crow | 99.0 /100 | #85 | Exceptional 94.7% |
| Puget Sound Salish | 99.0 /100 | #86 | Exceptional 94.7% |
| Immigrants | Saudi Arabia | 99.0 /100 | #87 | Exceptional 94.7% |
| Immigrants | Japan | 99.0 /100 | #88 | Exceptional 94.7% |
| Immigrants | Moldova | 98.9 /100 | #89 | Exceptional 94.7% |
| South Africans | 98.8 /100 | #90 | Exceptional 94.7% |
| Whites/Caucasians | 98.8 /100 | #91 | Exceptional 94.7% |
| Yugoslavians | 98.4 /100 | #92 | Exceptional 94.6% |
| Soviet Union | 98.3 /100 | #93 | Exceptional 94.6% |
| Immigrants | Germany | 98.3 /100 | #94 | Exceptional 94.6% |
| Menominee | 98.3 /100 | #95 | Exceptional 94.6% |
| Immigrants | Switzerland | 98.3 /100 | #96 | Exceptional 94.6% |
| Lebanese | 98.3 /100 | #97 | Exceptional 94.6% |
| Immigrants | Bulgaria | 98.1 /100 | #98 | Exceptional 94.6% |
Demographics Similar to Scottish by 10th Grade
In terms of 10th grade, the demographic groups most similar to Scottish are Irish (95.6%, a difference of 0.010%), Latvian (95.6%, a difference of 0.010%), Italian (95.6%, a difference of 0.020%), Scandinavian (95.6%, a difference of 0.020%), and Tsimshian (95.6%, a difference of 0.030%).
| Demographics | Rating | Rank | 10th Grade |
| Finns | 100.0 /100 | #9 | Exceptional 95.8% |
| Croatians | 100.0 /100 | #10 | Exceptional 95.7% |
| Danes | 100.0 /100 | #11 | Exceptional 95.7% |
| Tlingit-Haida | 100.0 /100 | #12 | Exceptional 95.7% |
| English | 100.0 /100 | #13 | Exceptional 95.6% |
| Tsimshian | 100.0 /100 | #14 | Exceptional 95.6% |
| Irish | 100.0 /100 | #15 | Exceptional 95.6% |
| Scottish | 100.0 /100 | #16 | Exceptional 95.6% |
| Latvians | 100.0 /100 | #17 | Exceptional 95.6% |
| Italians | 100.0 /100 | #18 | Exceptional 95.6% |
| Scandinavians | 100.0 /100 | #19 | Exceptional 95.6% |
| Chinese | 100.0 /100 | #20 | Exceptional 95.5% |
| Dutch | 100.0 /100 | #21 | Exceptional 95.5% |
| Eastern Europeans | 100.0 /100 | #22 | Exceptional 95.5% |
| Czechs | 100.0 /100 | #23 | Exceptional 95.5% |