Cree vs Scottish Per Capita Income
COMPARE
Cree
Scottish
Per Capita Income
Per Capita Income Comparison
Cree
Scottish
$40,056
PER CAPITA INCOME
1.7/ 100
METRIC RATING
246th/ 347
METRIC RANK
$44,440
PER CAPITA INCOME
70.6/ 100
METRIC RATING
153rd/ 347
METRIC RANK
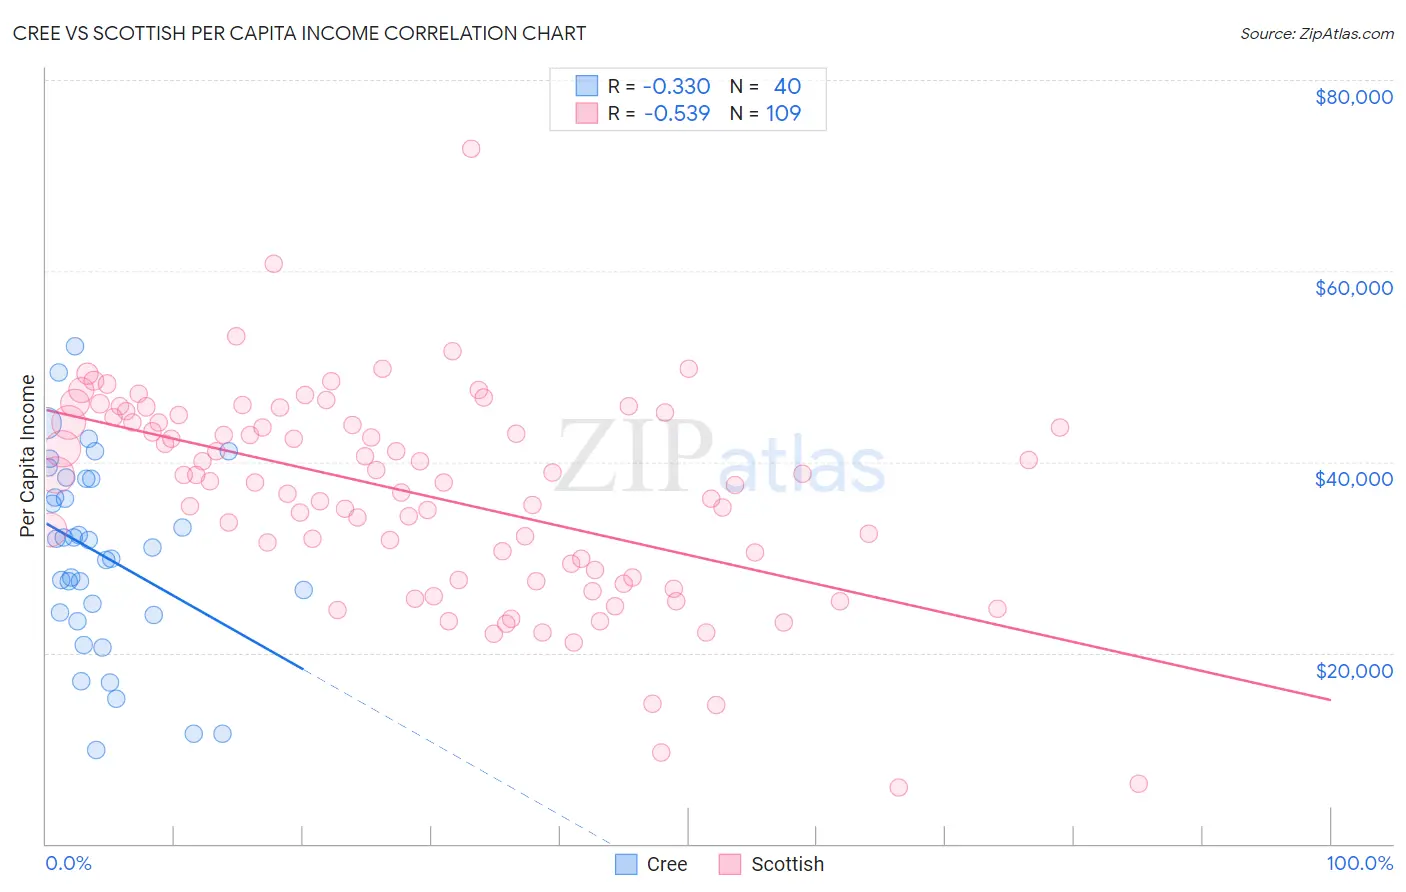
Cree vs Scottish Per Capita Income Correlation Chart
The statistical analysis conducted on geographies consisting of 76,211,685 people shows a mild negative correlation between the proportion of Cree and per capita income in the United States with a correlation coefficient (R) of -0.330 and weighted average of $40,056. Similarly, the statistical analysis conducted on geographies consisting of 567,196,152 people shows a substantial negative correlation between the proportion of Scottish and per capita income in the United States with a correlation coefficient (R) of -0.539 and weighted average of $44,440, a difference of 10.9%.
Per Capita Income Correlation Summary
| Measurement | Cree | Scottish |
| Minimum | $9,879 | $5,913 |
| Maximum | $52,079 | $72,790 |
| Range | $42,200 | $66,877 |
| Mean | $30,350 | $36,544 |
| Median | $31,398 | $37,961 |
| Interquartile 25% (IQ1) | $24,114 | $28,258 |
| Interquartile 75% (IQ3) | $38,235 | $44,399 |
| Interquartile Range (IQR) | $14,121 | $16,142 |
| Standard Deviation (Sample) | $10,115 | $10,868 |
| Standard Deviation (Population) | $9,988 | $10,818 |
Similar Demographics by Per Capita Income
Demographics Similar to Cree by Per Capita Income
In terms of per capita income, the demographic groups most similar to Cree are Immigrants from Somalia ($39,974, a difference of 0.20%), Subsaharan African ($40,152, a difference of 0.24%), Cape Verdean ($39,935, a difference of 0.30%), Japanese ($39,870, a difference of 0.46%), and French American Indian ($40,244, a difference of 0.47%).
| Demographics | Rating | Rank | Per Capita Income |
| Tsimshian | 2.4 /100 | #239 | Tragic $40,344 |
| Immigrants | Nigeria | 2.3 /100 | #240 | Tragic $40,339 |
| British West Indians | 2.3 /100 | #241 | Tragic $40,330 |
| Immigrants | Western Africa | 2.2 /100 | #242 | Tragic $40,294 |
| German Russians | 2.2 /100 | #243 | Tragic $40,266 |
| French American Indians | 2.1 /100 | #244 | Tragic $40,244 |
| Sub-Saharan Africans | 1.9 /100 | #245 | Tragic $40,152 |
| Cree | 1.7 /100 | #246 | Tragic $40,056 |
| Immigrants | Somalia | 1.6 /100 | #247 | Tragic $39,974 |
| Cape Verdeans | 1.5 /100 | #248 | Tragic $39,935 |
| Japanese | 1.4 /100 | #249 | Tragic $39,870 |
| Immigrants | Burma/Myanmar | 1.3 /100 | #250 | Tragic $39,827 |
| Samoans | 1.3 /100 | #251 | Tragic $39,826 |
| Immigrants | Azores | 1.0 /100 | #252 | Tragic $39,608 |
| Osage | 1.0 /100 | #253 | Tragic $39,568 |
Demographics Similar to Scottish by Per Capita Income
In terms of per capita income, the demographic groups most similar to Scottish are Norwegian ($44,480, a difference of 0.090%), Peruvian ($44,479, a difference of 0.090%), Immigrants from Eritrea ($44,509, a difference of 0.16%), Portuguese ($44,362, a difference of 0.18%), and Korean ($44,522, a difference of 0.19%).
| Demographics | Rating | Rank | Per Capita Income |
| Irish | 75.8 /100 | #146 | Good $44,679 |
| Czechs | 74.1 /100 | #147 | Good $44,595 |
| Immigrants | Armenia | 73.1 /100 | #148 | Good $44,552 |
| Koreans | 72.5 /100 | #149 | Good $44,522 |
| Immigrants | Eritrea | 72.1 /100 | #150 | Good $44,509 |
| Norwegians | 71.5 /100 | #151 | Good $44,480 |
| Peruvians | 71.5 /100 | #152 | Good $44,479 |
| Scottish | 70.6 /100 | #153 | Good $44,440 |
| Portuguese | 68.7 /100 | #154 | Good $44,362 |
| Uruguayans | 67.6 /100 | #155 | Good $44,318 |
| Slovaks | 65.4 /100 | #156 | Good $44,229 |
| South American Indians | 64.8 /100 | #157 | Good $44,206 |
| Immigrants | Nepal | 64.3 /100 | #158 | Good $44,187 |
| South Americans | 62.4 /100 | #159 | Good $44,114 |
| Danes | 61.9 /100 | #160 | Good $44,095 |