Maltese vs Scottish Per Capita Income
COMPARE
Maltese
Scottish
Per Capita Income
Per Capita Income Comparison
Maltese
Scottish
$49,640
PER CAPITA INCOME
99.9/ 100
METRIC RATING
63rd/ 347
METRIC RANK
$44,440
PER CAPITA INCOME
70.6/ 100
METRIC RATING
153rd/ 347
METRIC RANK
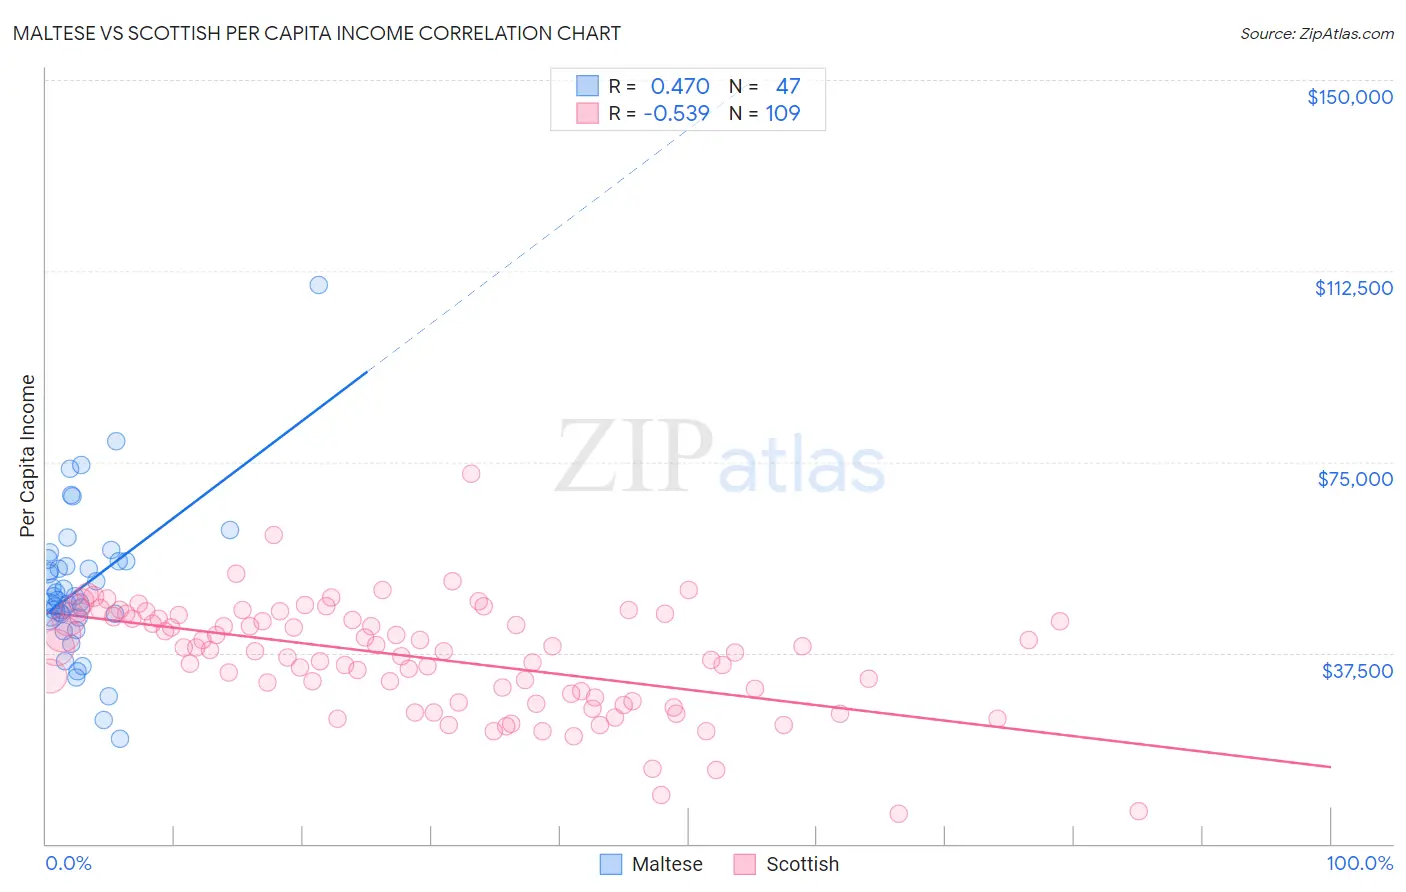
Maltese vs Scottish Per Capita Income Correlation Chart
The statistical analysis conducted on geographies consisting of 126,316,532 people shows a moderate positive correlation between the proportion of Maltese and per capita income in the United States with a correlation coefficient (R) of 0.470 and weighted average of $49,640. Similarly, the statistical analysis conducted on geographies consisting of 567,196,152 people shows a substantial negative correlation between the proportion of Scottish and per capita income in the United States with a correlation coefficient (R) of -0.539 and weighted average of $44,440, a difference of 11.7%.
Per Capita Income Correlation Summary
| Measurement | Maltese | Scottish |
| Minimum | $20,612 | $5,913 |
| Maximum | $109,686 | $72,790 |
| Range | $89,074 | $66,877 |
| Mean | $50,567 | $36,544 |
| Median | $48,495 | $37,961 |
| Interquartile 25% (IQ1) | $44,523 | $28,258 |
| Interquartile 75% (IQ3) | $55,569 | $44,399 |
| Interquartile Range (IQR) | $11,046 | $16,142 |
| Standard Deviation (Sample) | $14,877 | $10,868 |
| Standard Deviation (Population) | $14,718 | $10,818 |
Similar Demographics by Per Capita Income
Demographics Similar to Maltese by Per Capita Income
In terms of per capita income, the demographic groups most similar to Maltese are Immigrants from Argentina ($49,627, a difference of 0.030%), Immigrants from Asia ($49,741, a difference of 0.20%), Bolivian ($49,526, a difference of 0.23%), Immigrants from Bulgaria ($49,482, a difference of 0.32%), and Immigrants from Romania ($49,463, a difference of 0.36%).
| Demographics | Rating | Rank | Per Capita Income |
| Asians | 99.9 /100 | #56 | Exceptional $50,057 |
| South Africans | 99.9 /100 | #57 | Exceptional $50,044 |
| Immigrants | Malaysia | 99.9 /100 | #58 | Exceptional $49,983 |
| Bhutanese | 99.9 /100 | #59 | Exceptional $49,894 |
| Immigrants | Scotland | 99.9 /100 | #60 | Exceptional $49,893 |
| Argentineans | 99.9 /100 | #61 | Exceptional $49,862 |
| Immigrants | Asia | 99.9 /100 | #62 | Exceptional $49,741 |
| Maltese | 99.9 /100 | #63 | Exceptional $49,640 |
| Immigrants | Argentina | 99.9 /100 | #64 | Exceptional $49,627 |
| Bolivians | 99.9 /100 | #65 | Exceptional $49,526 |
| Immigrants | Bulgaria | 99.9 /100 | #66 | Exceptional $49,482 |
| Immigrants | Romania | 99.9 /100 | #67 | Exceptional $49,463 |
| Lithuanians | 99.8 /100 | #68 | Exceptional $49,448 |
| Immigrants | Canada | 99.8 /100 | #69 | Exceptional $49,412 |
| Immigrants | Eastern Europe | 99.8 /100 | #70 | Exceptional $49,316 |
Demographics Similar to Scottish by Per Capita Income
In terms of per capita income, the demographic groups most similar to Scottish are Norwegian ($44,480, a difference of 0.090%), Peruvian ($44,479, a difference of 0.090%), Immigrants from Eritrea ($44,509, a difference of 0.16%), Portuguese ($44,362, a difference of 0.18%), and Korean ($44,522, a difference of 0.19%).
| Demographics | Rating | Rank | Per Capita Income |
| Irish | 75.8 /100 | #146 | Good $44,679 |
| Czechs | 74.1 /100 | #147 | Good $44,595 |
| Immigrants | Armenia | 73.1 /100 | #148 | Good $44,552 |
| Koreans | 72.5 /100 | #149 | Good $44,522 |
| Immigrants | Eritrea | 72.1 /100 | #150 | Good $44,509 |
| Norwegians | 71.5 /100 | #151 | Good $44,480 |
| Peruvians | 71.5 /100 | #152 | Good $44,479 |
| Scottish | 70.6 /100 | #153 | Good $44,440 |
| Portuguese | 68.7 /100 | #154 | Good $44,362 |
| Uruguayans | 67.6 /100 | #155 | Good $44,318 |
| Slovaks | 65.4 /100 | #156 | Good $44,229 |
| South American Indians | 64.8 /100 | #157 | Good $44,206 |
| Immigrants | Nepal | 64.3 /100 | #158 | Good $44,187 |
| South Americans | 62.4 /100 | #159 | Good $44,114 |
| Danes | 61.9 /100 | #160 | Good $44,095 |