Taiwanese vs Scottish Per Capita Income
COMPARE
Taiwanese
Scottish
Per Capita Income
Per Capita Income Comparison
Taiwanese
Scottish
$46,455
PER CAPITA INCOME
95.8/ 100
METRIC RATING
111th/ 347
METRIC RANK
$44,440
PER CAPITA INCOME
70.6/ 100
METRIC RATING
153rd/ 347
METRIC RANK
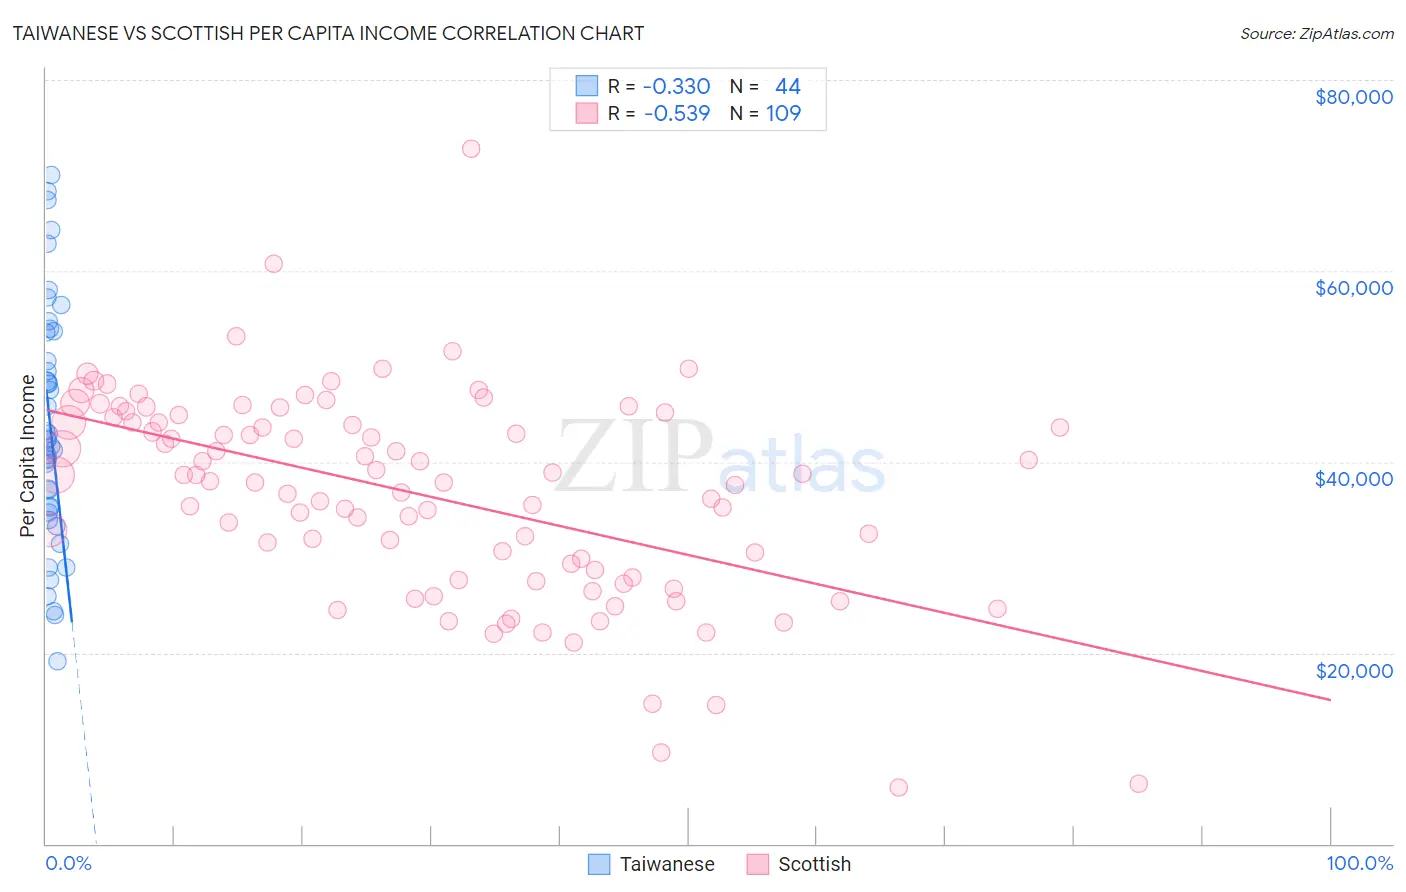
Taiwanese vs Scottish Per Capita Income Correlation Chart
The statistical analysis conducted on geographies consisting of 31,724,936 people shows a mild negative correlation between the proportion of Taiwanese and per capita income in the United States with a correlation coefficient (R) of -0.330 and weighted average of $46,455. Similarly, the statistical analysis conducted on geographies consisting of 567,196,152 people shows a substantial negative correlation between the proportion of Scottish and per capita income in the United States with a correlation coefficient (R) of -0.539 and weighted average of $44,440, a difference of 4.5%.
Per Capita Income Correlation Summary
| Measurement | Taiwanese | Scottish |
| Minimum | $19,108 | $5,913 |
| Maximum | $70,046 | $72,790 |
| Range | $50,938 | $66,877 |
| Mean | $43,880 | $36,544 |
| Median | $42,360 | $37,961 |
| Interquartile 25% (IQ1) | $34,944 | $28,258 |
| Interquartile 75% (IQ3) | $53,629 | $44,399 |
| Interquartile Range (IQR) | $18,684 | $16,142 |
| Standard Deviation (Sample) | $12,658 | $10,868 |
| Standard Deviation (Population) | $12,514 | $10,818 |
Similar Demographics by Per Capita Income
Demographics Similar to Taiwanese by Per Capita Income
In terms of per capita income, the demographic groups most similar to Taiwanese are Chilean ($46,459, a difference of 0.010%), Immigrants from Morocco ($46,430, a difference of 0.050%), Immigrants from Albania ($46,387, a difference of 0.14%), Immigrants from Northern Africa ($46,531, a difference of 0.16%), and Immigrants from Kuwait ($46,543, a difference of 0.19%).
| Demographics | Rating | Rank | Per Capita Income |
| Brazilians | 96.8 /100 | #104 | Exceptional $46,700 |
| British | 96.3 /100 | #105 | Exceptional $46,571 |
| Ethiopians | 96.3 /100 | #106 | Exceptional $46,569 |
| Serbians | 96.2 /100 | #107 | Exceptional $46,551 |
| Immigrants | Kuwait | 96.2 /100 | #108 | Exceptional $46,543 |
| Immigrants | Northern Africa | 96.2 /100 | #109 | Exceptional $46,531 |
| Chileans | 95.9 /100 | #110 | Exceptional $46,459 |
| Taiwanese | 95.8 /100 | #111 | Exceptional $46,455 |
| Immigrants | Morocco | 95.7 /100 | #112 | Exceptional $46,430 |
| Immigrants | Albania | 95.5 /100 | #113 | Exceptional $46,387 |
| Afghans | 94.9 /100 | #114 | Exceptional $46,268 |
| Immigrants | Chile | 94.6 /100 | #115 | Exceptional $46,213 |
| Poles | 94.1 /100 | #116 | Exceptional $46,123 |
| Chinese | 93.9 /100 | #117 | Exceptional $46,098 |
| Immigrants | Saudi Arabia | 93.3 /100 | #118 | Exceptional $46,008 |
Demographics Similar to Scottish by Per Capita Income
In terms of per capita income, the demographic groups most similar to Scottish are Norwegian ($44,480, a difference of 0.090%), Peruvian ($44,479, a difference of 0.090%), Immigrants from Eritrea ($44,509, a difference of 0.16%), Portuguese ($44,362, a difference of 0.18%), and Korean ($44,522, a difference of 0.19%).
| Demographics | Rating | Rank | Per Capita Income |
| Irish | 75.8 /100 | #146 | Good $44,679 |
| Czechs | 74.1 /100 | #147 | Good $44,595 |
| Immigrants | Armenia | 73.1 /100 | #148 | Good $44,552 |
| Koreans | 72.5 /100 | #149 | Good $44,522 |
| Immigrants | Eritrea | 72.1 /100 | #150 | Good $44,509 |
| Norwegians | 71.5 /100 | #151 | Good $44,480 |
| Peruvians | 71.5 /100 | #152 | Good $44,479 |
| Scottish | 70.6 /100 | #153 | Good $44,440 |
| Portuguese | 68.7 /100 | #154 | Good $44,362 |
| Uruguayans | 67.6 /100 | #155 | Good $44,318 |
| Slovaks | 65.4 /100 | #156 | Good $44,229 |
| South American Indians | 64.8 /100 | #157 | Good $44,206 |
| Immigrants | Nepal | 64.3 /100 | #158 | Good $44,187 |
| South Americans | 62.4 /100 | #159 | Good $44,114 |
| Danes | 61.9 /100 | #160 | Good $44,095 |