Pennsylvania German vs Scottish Per Capita Income
COMPARE
Pennsylvania German
Scottish
Per Capita Income
Per Capita Income Comparison
Pennsylvania Germans
Scottish
$37,842
PER CAPITA INCOME
0.1/ 100
METRIC RATING
283rd/ 347
METRIC RANK
$44,440
PER CAPITA INCOME
70.6/ 100
METRIC RATING
153rd/ 347
METRIC RANK
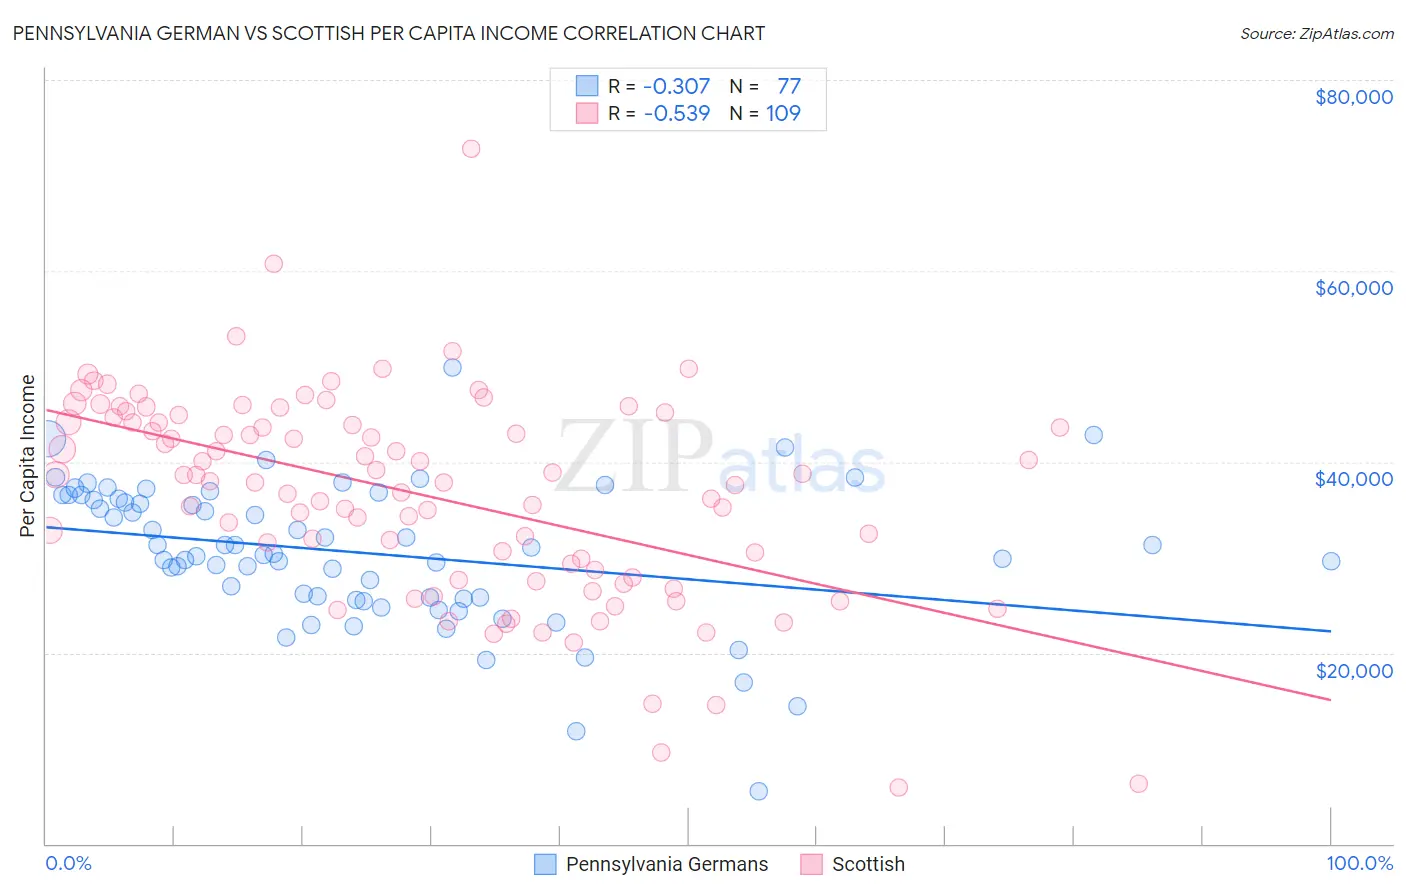
Pennsylvania German vs Scottish Per Capita Income Correlation Chart
The statistical analysis conducted on geographies consisting of 234,109,606 people shows a mild negative correlation between the proportion of Pennsylvania Germans and per capita income in the United States with a correlation coefficient (R) of -0.307 and weighted average of $37,842. Similarly, the statistical analysis conducted on geographies consisting of 567,196,152 people shows a substantial negative correlation between the proportion of Scottish and per capita income in the United States with a correlation coefficient (R) of -0.539 and weighted average of $44,440, a difference of 17.4%.
Per Capita Income Correlation Summary
| Measurement | Pennsylvania German | Scottish |
| Minimum | $5,500 | $5,913 |
| Maximum | $49,889 | $72,790 |
| Range | $44,389 | $66,877 |
| Mean | $30,450 | $36,544 |
| Median | $30,408 | $37,961 |
| Interquartile 25% (IQ1) | $25,731 | $28,258 |
| Interquartile 75% (IQ3) | $36,297 | $44,399 |
| Interquartile Range (IQR) | $10,566 | $16,142 |
| Standard Deviation (Sample) | $7,465 | $10,868 |
| Standard Deviation (Population) | $7,416 | $10,818 |
Similar Demographics by Per Capita Income
Demographics Similar to Pennsylvania Germans by Per Capita Income
In terms of per capita income, the demographic groups most similar to Pennsylvania Germans are Immigrants from Laos ($37,857, a difference of 0.040%), African ($37,785, a difference of 0.15%), Guatemalan ($37,766, a difference of 0.20%), Immigrants from Dominica ($37,952, a difference of 0.29%), and Central American Indian ($37,699, a difference of 0.38%).
| Demographics | Rating | Rank | Per Capita Income |
| Hmong | 0.2 /100 | #276 | Tragic $38,120 |
| Comanche | 0.2 /100 | #277 | Tragic $38,088 |
| Immigrants | Nicaragua | 0.2 /100 | #278 | Tragic $38,065 |
| Colville | 0.2 /100 | #279 | Tragic $38,047 |
| Potawatomi | 0.2 /100 | #280 | Tragic $38,046 |
| Immigrants | Dominica | 0.2 /100 | #281 | Tragic $37,952 |
| Immigrants | Laos | 0.1 /100 | #282 | Tragic $37,857 |
| Pennsylvania Germans | 0.1 /100 | #283 | Tragic $37,842 |
| Africans | 0.1 /100 | #284 | Tragic $37,785 |
| Guatemalans | 0.1 /100 | #285 | Tragic $37,766 |
| Central American Indians | 0.1 /100 | #286 | Tragic $37,699 |
| Dominicans | 0.1 /100 | #287 | Tragic $37,697 |
| Blackfeet | 0.1 /100 | #288 | Tragic $37,695 |
| U.S. Virgin Islanders | 0.1 /100 | #289 | Tragic $37,589 |
| Immigrants | Guatemala | 0.1 /100 | #290 | Tragic $37,550 |
Demographics Similar to Scottish by Per Capita Income
In terms of per capita income, the demographic groups most similar to Scottish are Norwegian ($44,480, a difference of 0.090%), Peruvian ($44,479, a difference of 0.090%), Immigrants from Eritrea ($44,509, a difference of 0.16%), Portuguese ($44,362, a difference of 0.18%), and Korean ($44,522, a difference of 0.19%).
| Demographics | Rating | Rank | Per Capita Income |
| Irish | 75.8 /100 | #146 | Good $44,679 |
| Czechs | 74.1 /100 | #147 | Good $44,595 |
| Immigrants | Armenia | 73.1 /100 | #148 | Good $44,552 |
| Koreans | 72.5 /100 | #149 | Good $44,522 |
| Immigrants | Eritrea | 72.1 /100 | #150 | Good $44,509 |
| Norwegians | 71.5 /100 | #151 | Good $44,480 |
| Peruvians | 71.5 /100 | #152 | Good $44,479 |
| Scottish | 70.6 /100 | #153 | Good $44,440 |
| Portuguese | 68.7 /100 | #154 | Good $44,362 |
| Uruguayans | 67.6 /100 | #155 | Good $44,318 |
| Slovaks | 65.4 /100 | #156 | Good $44,229 |
| South American Indians | 64.8 /100 | #157 | Good $44,206 |
| Immigrants | Nepal | 64.3 /100 | #158 | Good $44,187 |
| South Americans | 62.4 /100 | #159 | Good $44,114 |
| Danes | 61.9 /100 | #160 | Good $44,095 |