Irish vs Immigrants from Poland Per Capita Income
COMPARE
Irish
Immigrants from Poland
Per Capita Income
Per Capita Income Comparison
Irish
Immigrants from Poland
$44,679
PER CAPITA INCOME
75.8/ 100
METRIC RATING
146th/ 347
METRIC RANK
$45,979
PER CAPITA INCOME
93.1/ 100
METRIC RATING
119th/ 347
METRIC RANK
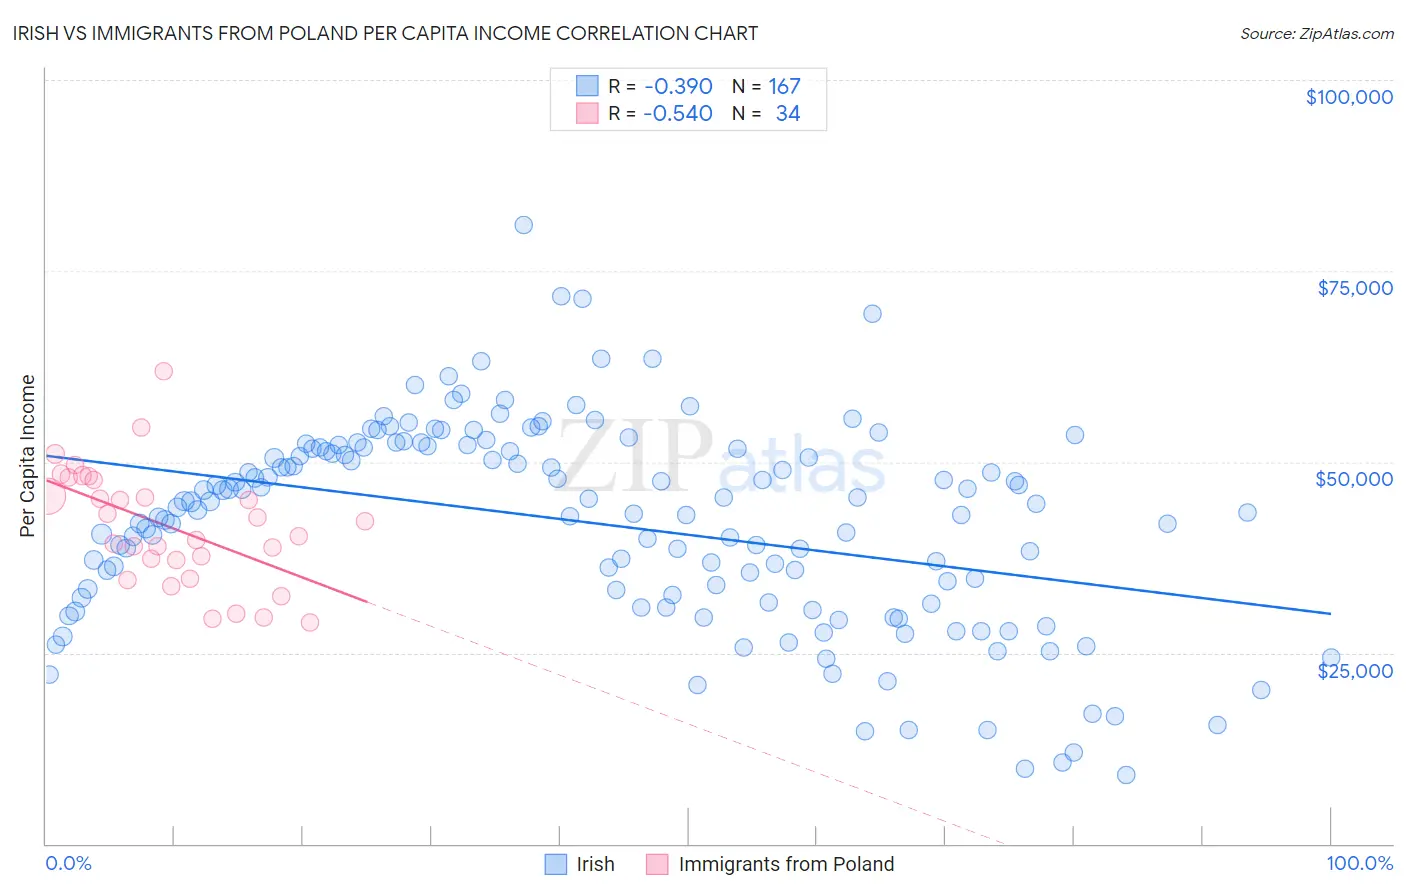
Irish vs Immigrants from Poland Per Capita Income Correlation Chart
The statistical analysis conducted on geographies consisting of 580,769,300 people shows a mild negative correlation between the proportion of Irish and per capita income in the United States with a correlation coefficient (R) of -0.390 and weighted average of $44,679. Similarly, the statistical analysis conducted on geographies consisting of 304,861,873 people shows a substantial negative correlation between the proportion of Immigrants from Poland and per capita income in the United States with a correlation coefficient (R) of -0.540 and weighted average of $45,979, a difference of 2.9%.
Per Capita Income Correlation Summary
| Measurement | Irish | Immigrants from Poland |
| Minimum | $9,015 | $28,915 |
| Maximum | $80,942 | $61,894 |
| Range | $71,927 | $32,979 |
| Mean | $42,054 | $41,553 |
| Median | $44,449 | $41,224 |
| Interquartile 25% (IQ1) | $32,164 | $37,111 |
| Interquartile 75% (IQ3) | $51,890 | $47,562 |
| Interquartile Range (IQR) | $19,726 | $10,451 |
| Standard Deviation (Sample) | $13,324 | $7,628 |
| Standard Deviation (Population) | $13,284 | $7,515 |
Similar Demographics by Per Capita Income
Demographics Similar to Irish by Per Capita Income
In terms of per capita income, the demographic groups most similar to Irish are Czech ($44,595, a difference of 0.19%), Immigrants from Afghanistan ($44,790, a difference of 0.25%), Immigrants from Armenia ($44,552, a difference of 0.28%), Korean ($44,522, a difference of 0.35%), and Immigrants from Eritrea ($44,509, a difference of 0.38%).
| Demographics | Rating | Rank | Per Capita Income |
| Basques | 83.2 /100 | #139 | Excellent $45,086 |
| Immigrants | Jordan | 82.9 /100 | #140 | Excellent $45,066 |
| Slavs | 82.6 /100 | #141 | Excellent $45,049 |
| Ugandans | 82.6 /100 | #142 | Excellent $45,047 |
| Immigrants | Uganda | 82.5 /100 | #143 | Excellent $45,043 |
| Icelanders | 81.6 /100 | #144 | Excellent $44,987 |
| Immigrants | Afghanistan | 78.0 /100 | #145 | Good $44,790 |
| Irish | 75.8 /100 | #146 | Good $44,679 |
| Czechs | 74.1 /100 | #147 | Good $44,595 |
| Immigrants | Armenia | 73.1 /100 | #148 | Good $44,552 |
| Koreans | 72.5 /100 | #149 | Good $44,522 |
| Immigrants | Eritrea | 72.1 /100 | #150 | Good $44,509 |
| Norwegians | 71.5 /100 | #151 | Good $44,480 |
| Peruvians | 71.5 /100 | #152 | Good $44,479 |
| Scottish | 70.6 /100 | #153 | Good $44,440 |
Demographics Similar to Immigrants from Poland by Per Capita Income
In terms of per capita income, the demographic groups most similar to Immigrants from Poland are Immigrants from Saudi Arabia ($46,008, a difference of 0.060%), Immigrants from Ethiopia ($45,923, a difference of 0.12%), Chinese ($46,098, a difference of 0.26%), Canadian ($45,858, a difference of 0.27%), and Moroccan ($45,854, a difference of 0.27%).
| Demographics | Rating | Rank | Per Capita Income |
| Immigrants | Morocco | 95.7 /100 | #112 | Exceptional $46,430 |
| Immigrants | Albania | 95.5 /100 | #113 | Exceptional $46,387 |
| Afghans | 94.9 /100 | #114 | Exceptional $46,268 |
| Immigrants | Chile | 94.6 /100 | #115 | Exceptional $46,213 |
| Poles | 94.1 /100 | #116 | Exceptional $46,123 |
| Chinese | 93.9 /100 | #117 | Exceptional $46,098 |
| Immigrants | Saudi Arabia | 93.3 /100 | #118 | Exceptional $46,008 |
| Immigrants | Poland | 93.1 /100 | #119 | Exceptional $45,979 |
| Immigrants | Ethiopia | 92.7 /100 | #120 | Exceptional $45,923 |
| Canadians | 92.2 /100 | #121 | Exceptional $45,858 |
| Moroccans | 92.1 /100 | #122 | Exceptional $45,854 |
| Lebanese | 92.0 /100 | #123 | Exceptional $45,840 |
| Europeans | 92.0 /100 | #124 | Exceptional $45,836 |
| Zimbabweans | 91.7 /100 | #125 | Exceptional $45,804 |
| Palestinians | 91.6 /100 | #126 | Exceptional $45,790 |