Hopi vs Immigrants from Poland Per Capita Income
COMPARE
Hopi
Immigrants from Poland
Per Capita Income
Per Capita Income Comparison
Hopi
Immigrants from Poland
$31,177
PER CAPITA INCOME
0.0/ 100
METRIC RATING
342nd/ 347
METRIC RANK
$45,979
PER CAPITA INCOME
93.1/ 100
METRIC RATING
119th/ 347
METRIC RANK
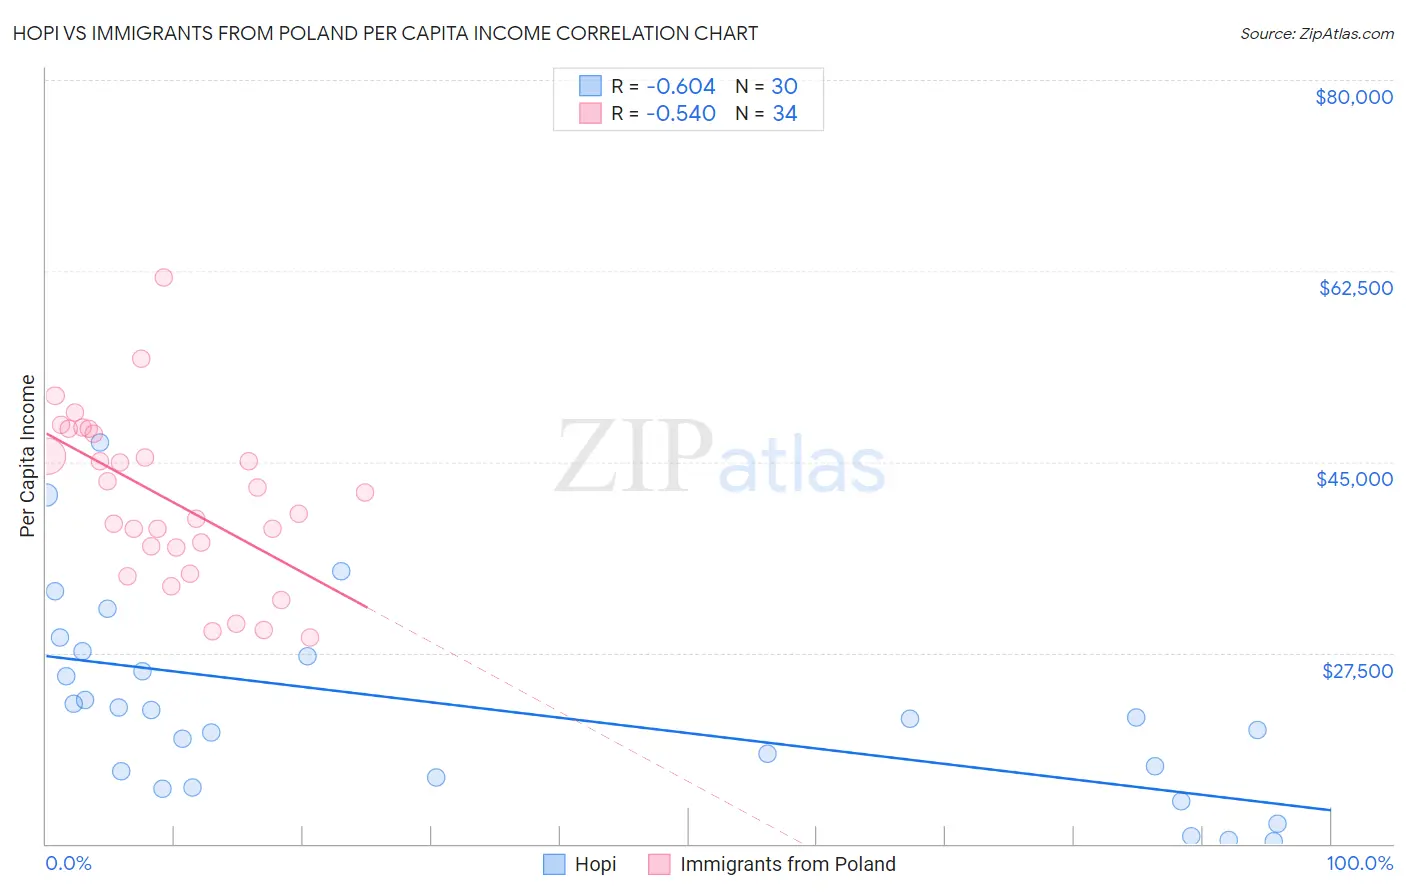
Hopi vs Immigrants from Poland Per Capita Income Correlation Chart
The statistical analysis conducted on geographies consisting of 74,740,168 people shows a significant negative correlation between the proportion of Hopi and per capita income in the United States with a correlation coefficient (R) of -0.604 and weighted average of $31,177. Similarly, the statistical analysis conducted on geographies consisting of 304,861,873 people shows a substantial negative correlation between the proportion of Immigrants from Poland and per capita income in the United States with a correlation coefficient (R) of -0.540 and weighted average of $45,979, a difference of 47.5%.
Per Capita Income Correlation Summary
| Measurement | Hopi | Immigrants from Poland |
| Minimum | $10,249 | $28,915 |
| Maximum | $46,736 | $61,894 |
| Range | $36,487 | $32,979 |
| Mean | $22,420 | $41,553 |
| Median | $21,540 | $41,224 |
| Interquartile 25% (IQ1) | $16,031 | $37,111 |
| Interquartile 75% (IQ3) | $27,162 | $47,562 |
| Interquartile Range (IQR) | $11,131 | $10,451 |
| Standard Deviation (Sample) | $8,915 | $7,628 |
| Standard Deviation (Population) | $8,765 | $7,515 |
Similar Demographics by Per Capita Income
Demographics Similar to Hopi by Per Capita Income
In terms of per capita income, the demographic groups most similar to Hopi are Puerto Rican ($31,268, a difference of 0.29%), Pima ($30,644, a difference of 1.7%), Crow ($31,729, a difference of 1.8%), Yup'ik ($30,518, a difference of 2.2%), and Pueblo ($32,012, a difference of 2.7%).
| Demographics | Rating | Rank | Per Capita Income |
| Immigrants | Yemen | 0.0 /100 | #333 | Tragic $33,696 |
| Natives/Alaskans | 0.0 /100 | #334 | Tragic $33,279 |
| Yuman | 0.0 /100 | #335 | Tragic $33,236 |
| Yakama | 0.0 /100 | #336 | Tragic $33,009 |
| Houma | 0.0 /100 | #337 | Tragic $32,996 |
| Arapaho | 0.0 /100 | #338 | Tragic $32,345 |
| Pueblo | 0.0 /100 | #339 | Tragic $32,012 |
| Crow | 0.0 /100 | #340 | Tragic $31,729 |
| Puerto Ricans | 0.0 /100 | #341 | Tragic $31,268 |
| Hopi | 0.0 /100 | #342 | Tragic $31,177 |
| Pima | 0.0 /100 | #343 | Tragic $30,644 |
| Yup'ik | 0.0 /100 | #344 | Tragic $30,518 |
| Tohono O'odham | 0.0 /100 | #345 | Tragic $30,256 |
| Lumbee | 0.0 /100 | #346 | Tragic $29,845 |
| Navajo | 0.0 /100 | #347 | Tragic $29,031 |
Demographics Similar to Immigrants from Poland by Per Capita Income
In terms of per capita income, the demographic groups most similar to Immigrants from Poland are Immigrants from Saudi Arabia ($46,008, a difference of 0.060%), Immigrants from Ethiopia ($45,923, a difference of 0.12%), Chinese ($46,098, a difference of 0.26%), Canadian ($45,858, a difference of 0.27%), and Moroccan ($45,854, a difference of 0.27%).
| Demographics | Rating | Rank | Per Capita Income |
| Immigrants | Morocco | 95.7 /100 | #112 | Exceptional $46,430 |
| Immigrants | Albania | 95.5 /100 | #113 | Exceptional $46,387 |
| Afghans | 94.9 /100 | #114 | Exceptional $46,268 |
| Immigrants | Chile | 94.6 /100 | #115 | Exceptional $46,213 |
| Poles | 94.1 /100 | #116 | Exceptional $46,123 |
| Chinese | 93.9 /100 | #117 | Exceptional $46,098 |
| Immigrants | Saudi Arabia | 93.3 /100 | #118 | Exceptional $46,008 |
| Immigrants | Poland | 93.1 /100 | #119 | Exceptional $45,979 |
| Immigrants | Ethiopia | 92.7 /100 | #120 | Exceptional $45,923 |
| Canadians | 92.2 /100 | #121 | Exceptional $45,858 |
| Moroccans | 92.1 /100 | #122 | Exceptional $45,854 |
| Lebanese | 92.0 /100 | #123 | Exceptional $45,840 |
| Europeans | 92.0 /100 | #124 | Exceptional $45,836 |
| Zimbabweans | 91.7 /100 | #125 | Exceptional $45,804 |
| Palestinians | 91.6 /100 | #126 | Exceptional $45,790 |