White/Caucasian vs Immigrants from Poland Ambulatory Disability
COMPARE
White/Caucasian
Immigrants from Poland
Ambulatory Disability
Ambulatory Disability Comparison
Whites/Caucasians
Immigrants from Poland
6.7%
AMBULATORY DISABILITY
0.1/ 100
METRIC RATING
273rd/ 347
METRIC RANK
5.9%
AMBULATORY DISABILITY
95.4/ 100
METRIC RATING
114th/ 347
METRIC RANK
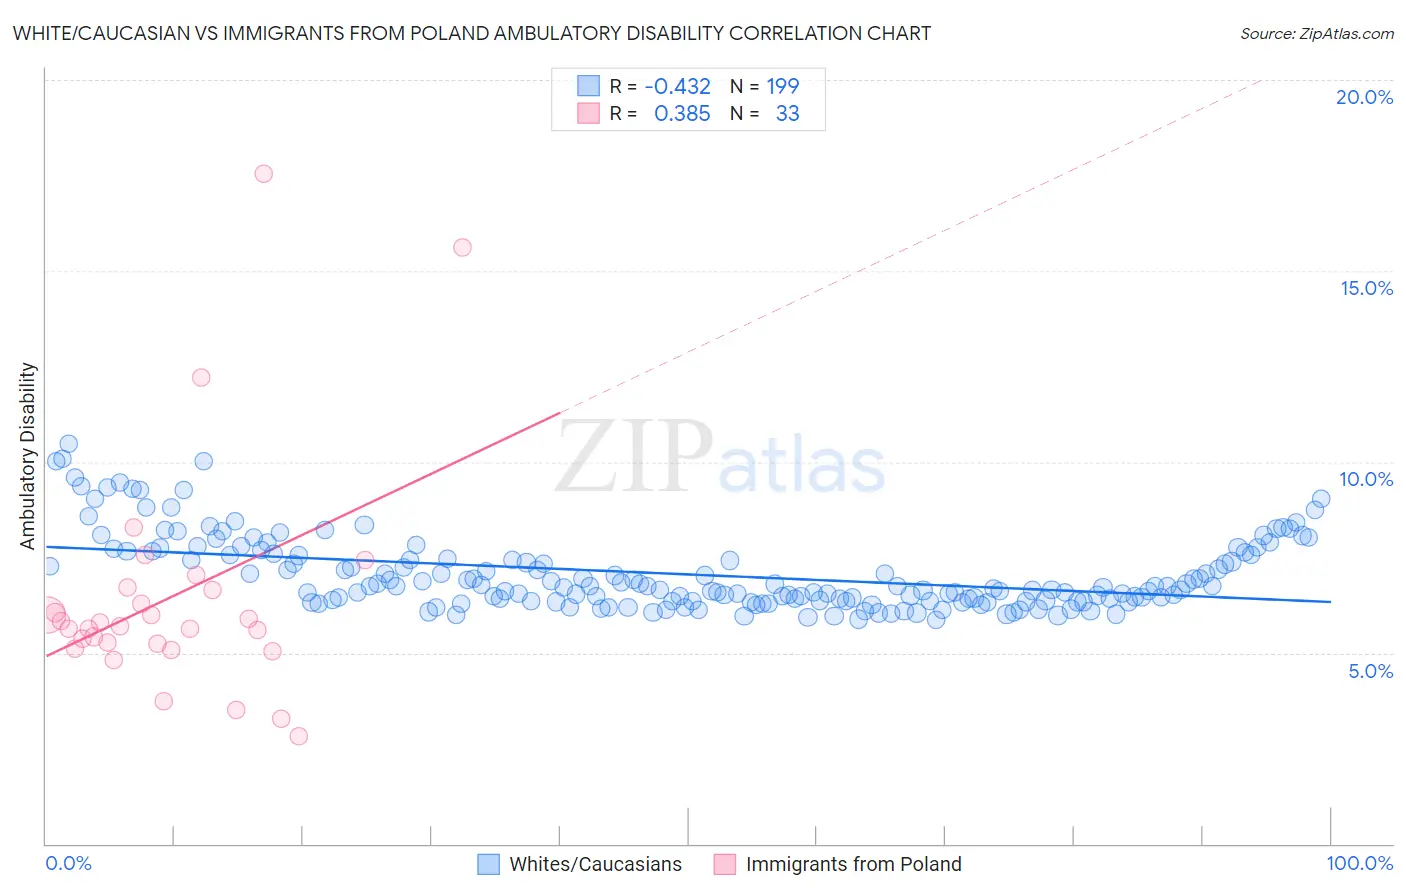
White/Caucasian vs Immigrants from Poland Ambulatory Disability Correlation Chart
The statistical analysis conducted on geographies consisting of 582,664,974 people shows a moderate negative correlation between the proportion of Whites/Caucasians and percentage of population with ambulatory disability in the United States with a correlation coefficient (R) of -0.432 and weighted average of 6.7%. Similarly, the statistical analysis conducted on geographies consisting of 304,808,570 people shows a mild positive correlation between the proportion of Immigrants from Poland and percentage of population with ambulatory disability in the United States with a correlation coefficient (R) of 0.385 and weighted average of 5.9%, a difference of 14.0%.
Ambulatory Disability Correlation Summary
| Measurement | White/Caucasian | Immigrants from Poland |
| Minimum | 5.9% | 2.8% |
| Maximum | 10.5% | 17.5% |
| Range | 4.6% | 14.7% |
| Mean | 7.1% | 6.5% |
| Median | 6.7% | 5.7% |
| Interquartile 25% (IQ1) | 6.4% | 5.2% |
| Interquartile 75% (IQ3) | 7.6% | 6.7% |
| Interquartile Range (IQR) | 1.2% | 1.5% |
| Standard Deviation (Sample) | 0.96% | 3.1% |
| Standard Deviation (Population) | 0.96% | 3.0% |
Similar Demographics by Ambulatory Disability
Demographics Similar to Whites/Caucasians by Ambulatory Disability
In terms of ambulatory disability, the demographic groups most similar to Whites/Caucasians are French Canadian (6.7%, a difference of 0.020%), Sioux (6.7%, a difference of 0.24%), Immigrants from Guyana (6.7%, a difference of 0.31%), Celtic (6.7%, a difference of 0.34%), and Immigrants from Trinidad and Tobago (6.7%, a difference of 0.38%).
| Demographics | Rating | Rank | Ambulatory Disability |
| Guyanese | 0.2 /100 | #266 | Tragic 6.6% |
| Trinidadians and Tobagonians | 0.2 /100 | #267 | Tragic 6.6% |
| Spanish | 0.2 /100 | #268 | Tragic 6.6% |
| French | 0.1 /100 | #269 | Tragic 6.6% |
| Slovaks | 0.1 /100 | #270 | Tragic 6.7% |
| Immigrants | Trinidad and Tobago | 0.1 /100 | #271 | Tragic 6.7% |
| French Canadians | 0.1 /100 | #272 | Tragic 6.7% |
| Whites/Caucasians | 0.1 /100 | #273 | Tragic 6.7% |
| Sioux | 0.1 /100 | #274 | Tragic 6.7% |
| Immigrants | Guyana | 0.1 /100 | #275 | Tragic 6.7% |
| Celtics | 0.1 /100 | #276 | Tragic 6.7% |
| Jamaicans | 0.1 /100 | #277 | Tragic 6.7% |
| Immigrants | West Indies | 0.1 /100 | #278 | Tragic 6.7% |
| Immigrants | Caribbean | 0.0 /100 | #279 | Tragic 6.7% |
| Pennsylvania Germans | 0.0 /100 | #280 | Tragic 6.8% |
Demographics Similar to Immigrants from Poland by Ambulatory Disability
In terms of ambulatory disability, the demographic groups most similar to Immigrants from Poland are Immigrants from Uruguay (5.9%, a difference of 0.060%), South American Indian (5.9%, a difference of 0.21%), Immigrants from Africa (5.9%, a difference of 0.22%), South African (5.9%, a difference of 0.28%), and Danish (5.8%, a difference of 0.41%).
| Demographics | Rating | Rank | Ambulatory Disability |
| Uruguayans | 97.2 /100 | #107 | Exceptional 5.8% |
| Colombians | 97.2 /100 | #108 | Exceptional 5.8% |
| Immigrants | Netherlands | 97.1 /100 | #109 | Exceptional 5.8% |
| Immigrants | Colombia | 96.7 /100 | #110 | Exceptional 5.8% |
| Danes | 96.6 /100 | #111 | Exceptional 5.8% |
| South Africans | 96.3 /100 | #112 | Exceptional 5.9% |
| Immigrants | Uruguay | 95.6 /100 | #113 | Exceptional 5.9% |
| Immigrants | Poland | 95.4 /100 | #114 | Exceptional 5.9% |
| South American Indians | 94.8 /100 | #115 | Exceptional 5.9% |
| Immigrants | Africa | 94.7 /100 | #116 | Exceptional 5.9% |
| Immigrants | South Eastern Asia | 93.6 /100 | #117 | Exceptional 5.9% |
| Russians | 93.4 /100 | #118 | Exceptional 5.9% |
| Norwegians | 93.1 /100 | #119 | Exceptional 5.9% |
| Estonians | 92.9 /100 | #120 | Exceptional 5.9% |
| Costa Ricans | 92.6 /100 | #121 | Exceptional 5.9% |