White/Caucasian vs Immigrants from Poland Professional Degree
COMPARE
White/Caucasian
Immigrants from Poland
Professional Degree
Professional Degree Comparison
Whites/Caucasians
Immigrants from Poland
4.1%
PROFESSIONAL DEGREE
11.2/ 100
METRIC RATING
212th/ 347
METRIC RANK
4.3%
PROFESSIONAL DEGREE
29.2/ 100
METRIC RATING
190th/ 347
METRIC RANK
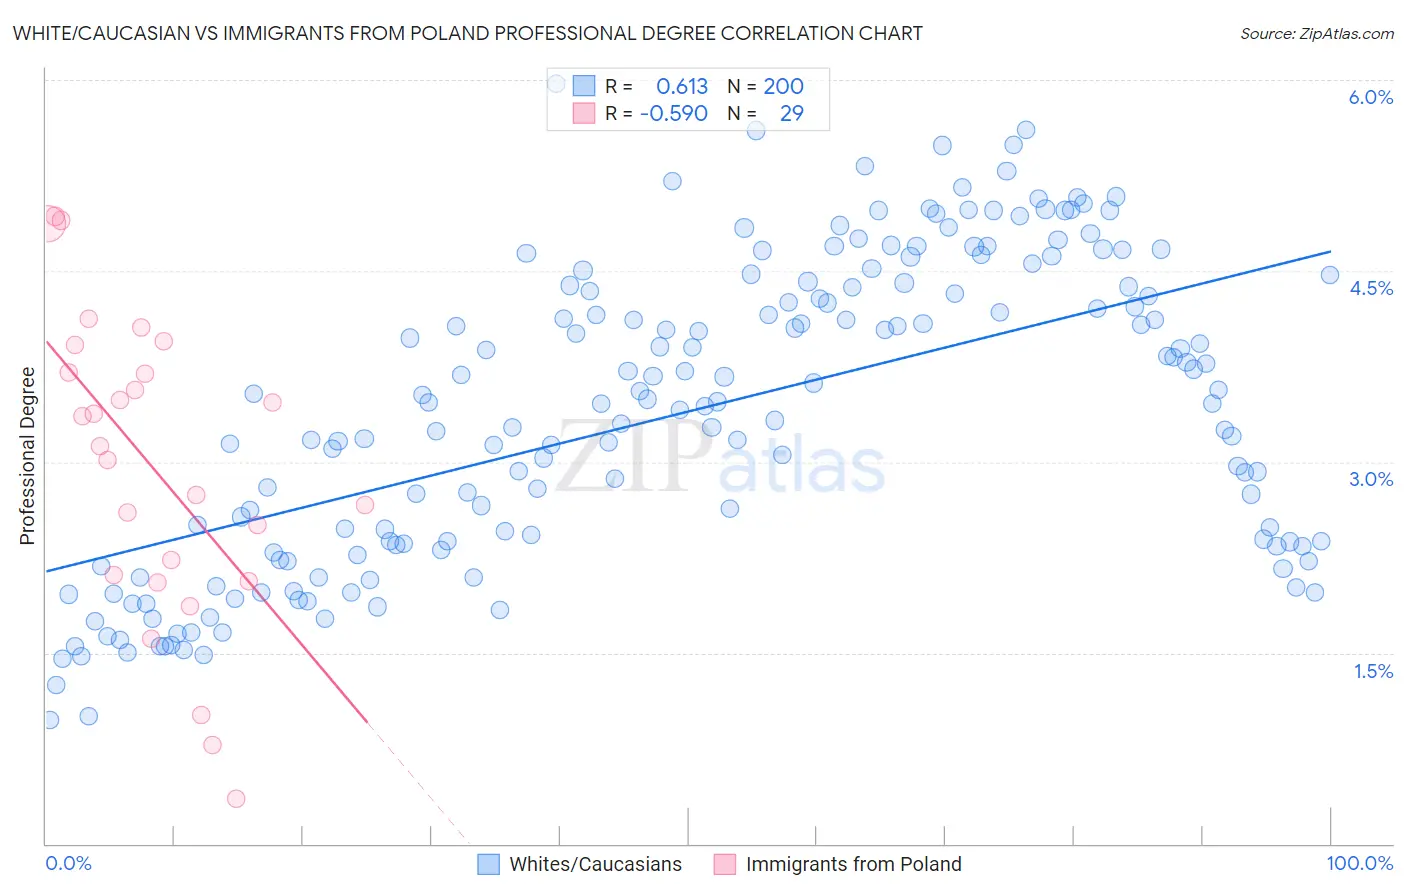
White/Caucasian vs Immigrants from Poland Professional Degree Correlation Chart
The statistical analysis conducted on geographies consisting of 572,420,788 people shows a significant positive correlation between the proportion of Whites/Caucasians and percentage of population with at least professional degree education in the United States with a correlation coefficient (R) of 0.613 and weighted average of 4.1%. Similarly, the statistical analysis conducted on geographies consisting of 304,504,967 people shows a substantial negative correlation between the proportion of Immigrants from Poland and percentage of population with at least professional degree education in the United States with a correlation coefficient (R) of -0.590 and weighted average of 4.3%, a difference of 4.7%.
Professional Degree Correlation Summary
| Measurement | White/Caucasian | Immigrants from Poland |
| Minimum | 0.97% | 0.35% |
| Maximum | 6.0% | 4.9% |
| Range | 5.0% | 4.6% |
| Mean | 3.4% | 3.0% |
| Median | 3.5% | 3.1% |
| Interquartile 25% (IQ1) | 2.3% | 2.1% |
| Interquartile 75% (IQ3) | 4.4% | 3.8% |
| Interquartile Range (IQR) | 2.0% | 1.7% |
| Standard Deviation (Sample) | 1.2% | 1.2% |
| Standard Deviation (Population) | 1.2% | 1.2% |
Similar Demographics by Professional Degree
Demographics Similar to Whites/Caucasians by Professional Degree
In terms of professional degree, the demographic groups most similar to Whites/Caucasians are German (4.1%, a difference of 0.18%), Korean (4.1%, a difference of 0.18%), Immigrants from Nigeria (4.1%, a difference of 0.21%), Immigrants from Ghana (4.1%, a difference of 0.23%), and Portuguese (4.1%, a difference of 0.28%).
| Demographics | Rating | Rank | Professional Degree |
| Somalis | 14.8 /100 | #205 | Poor 4.1% |
| Yugoslavians | 13.4 /100 | #206 | Poor 4.1% |
| Sub-Saharan Africans | 12.8 /100 | #207 | Poor 4.1% |
| Immigrants | Somalia | 12.5 /100 | #208 | Poor 4.1% |
| Immigrants | Panama | 12.3 /100 | #209 | Poor 4.1% |
| Immigrants | Nigeria | 11.7 /100 | #210 | Poor 4.1% |
| Germans | 11.6 /100 | #211 | Poor 4.1% |
| Whites/Caucasians | 11.2 /100 | #212 | Poor 4.1% |
| Koreans | 10.7 /100 | #213 | Poor 4.1% |
| Immigrants | Ghana | 10.6 /100 | #214 | Poor 4.1% |
| Portuguese | 10.5 /100 | #215 | Poor 4.1% |
| West Indians | 9.8 /100 | #216 | Tragic 4.1% |
| Immigrants | Vietnam | 9.4 /100 | #217 | Tragic 4.0% |
| Dutch | 9.0 /100 | #218 | Tragic 4.0% |
| Immigrants | South Eastern Asia | 8.9 /100 | #219 | Tragic 4.0% |
Demographics Similar to Immigrants from Poland by Professional Degree
In terms of professional degree, the demographic groups most similar to Immigrants from Poland are Sri Lankan (4.3%, a difference of 0.040%), Slovak (4.3%, a difference of 0.26%), Ghanaian (4.3%, a difference of 0.36%), French (4.2%, a difference of 0.40%), and Immigrants from Thailand (4.3%, a difference of 0.44%).
| Demographics | Rating | Rank | Professional Degree |
| Bermudans | 43.1 /100 | #183 | Average 4.4% |
| Belgians | 36.2 /100 | #184 | Fair 4.3% |
| Welsh | 35.8 /100 | #185 | Fair 4.3% |
| Scotch-Irish | 34.2 /100 | #186 | Fair 4.3% |
| Immigrants | Cameroon | 33.3 /100 | #187 | Fair 4.3% |
| Immigrants | Thailand | 31.7 /100 | #188 | Fair 4.3% |
| Slovaks | 30.7 /100 | #189 | Fair 4.3% |
| Immigrants | Poland | 29.2 /100 | #190 | Fair 4.3% |
| Sri Lankans | 29.0 /100 | #191 | Fair 4.3% |
| Ghanaians | 27.3 /100 | #192 | Fair 4.3% |
| French | 27.1 /100 | #193 | Fair 4.2% |
| Scandinavians | 25.8 /100 | #194 | Fair 4.2% |
| Nigerians | 24.6 /100 | #195 | Fair 4.2% |
| Spanish | 23.0 /100 | #196 | Fair 4.2% |
| Czechoslovakians | 22.4 /100 | #197 | Fair 4.2% |