White/Caucasian vs Immigrants from Poland College, 1 year or more
COMPARE
White/Caucasian
Immigrants from Poland
College, 1 year or more
College, 1 year or more Comparison
Whites/Caucasians
Immigrants from Poland
57.6%
COLLEGE, 1 YEAR OR MORE
8.7/ 100
METRIC RATING
219th/ 347
METRIC RANK
59.4%
COLLEGE, 1 YEAR OR MORE
48.9/ 100
METRIC RATING
176th/ 347
METRIC RANK
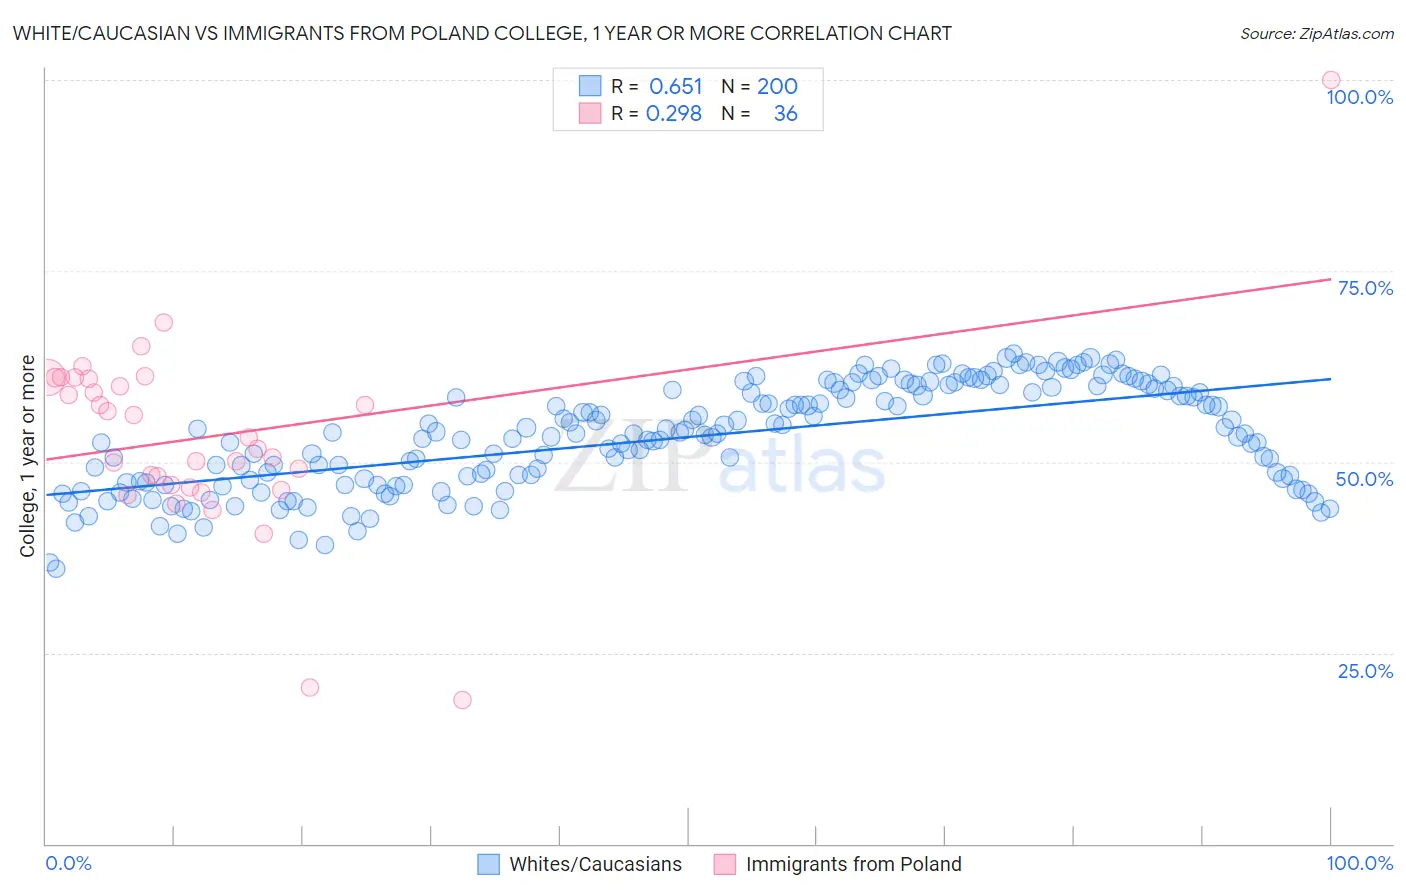
White/Caucasian vs Immigrants from Poland College, 1 year or more Correlation Chart
The statistical analysis conducted on geographies consisting of 585,171,968 people shows a significant positive correlation between the proportion of Whites/Caucasians and percentage of population with at least college, 1 year or more education in the United States with a correlation coefficient (R) of 0.651 and weighted average of 57.6%. Similarly, the statistical analysis conducted on geographies consisting of 304,861,916 people shows a weak positive correlation between the proportion of Immigrants from Poland and percentage of population with at least college, 1 year or more education in the United States with a correlation coefficient (R) of 0.298 and weighted average of 59.4%, a difference of 3.2%.
College, 1 year or more Correlation Summary
| Measurement | White/Caucasian | Immigrants from Poland |
| Minimum | 36.1% | 18.8% |
| Maximum | 64.2% | 100.0% |
| Range | 28.2% | 81.2% |
| Mean | 53.2% | 53.3% |
| Median | 53.7% | 52.5% |
| Interquartile 25% (IQ1) | 47.4% | 46.8% |
| Interquartile 75% (IQ3) | 59.5% | 60.9% |
| Interquartile Range (IQR) | 12.1% | 14.1% |
| Standard Deviation (Sample) | 6.7% | 13.2% |
| Standard Deviation (Population) | 6.7% | 13.0% |
Similar Demographics by College, 1 year or more
Demographics Similar to Whites/Caucasians by College, 1 year or more
In terms of college, 1 year or more, the demographic groups most similar to Whites/Caucasians are Native Hawaiian (57.6%, a difference of 0.060%), Immigrants from Panama (57.6%, a difference of 0.070%), Immigrants from Costa Rica (57.5%, a difference of 0.12%), Immigrants from Ghana (57.4%, a difference of 0.19%), and Immigrants from Peru (57.7%, a difference of 0.30%).
| Demographics | Rating | Rank | College, 1 year or more |
| Immigrants | Senegal | 11.8 /100 | #212 | Poor 57.8% |
| French Canadians | 11.8 /100 | #213 | Poor 57.8% |
| Immigrants | Colombia | 11.6 /100 | #214 | Poor 57.8% |
| Tongans | 11.6 /100 | #215 | Poor 57.8% |
| Immigrants | Peru | 10.6 /100 | #216 | Poor 57.7% |
| Immigrants | Panama | 9.1 /100 | #217 | Tragic 57.6% |
| Native Hawaiians | 9.0 /100 | #218 | Tragic 57.6% |
| Whites/Caucasians | 8.7 /100 | #219 | Tragic 57.6% |
| Immigrants | Costa Rica | 8.0 /100 | #220 | Tragic 57.5% |
| Immigrants | Ghana | 7.7 /100 | #221 | Tragic 57.4% |
| Sub-Saharan Africans | 6.1 /100 | #222 | Tragic 57.3% |
| Portuguese | 5.4 /100 | #223 | Tragic 57.2% |
| Hmong | 5.4 /100 | #224 | Tragic 57.2% |
| Vietnamese | 4.7 /100 | #225 | Tragic 57.0% |
| Immigrants | Western Africa | 4.6 /100 | #226 | Tragic 57.0% |
Demographics Similar to Immigrants from Poland by College, 1 year or more
In terms of college, 1 year or more, the demographic groups most similar to Immigrants from Poland are Sri Lankan (59.4%, a difference of 0.010%), Tlingit-Haida (59.4%, a difference of 0.030%), Czechoslovakian (59.4%, a difference of 0.030%), Celtic (59.4%, a difference of 0.060%), and Immigrants from Oceania (59.4%, a difference of 0.12%).
| Demographics | Rating | Rank | College, 1 year or more |
| Immigrants | Southern Europe | 52.7 /100 | #169 | Average 59.5% |
| Welsh | 52.4 /100 | #170 | Average 59.5% |
| Immigrants | Albania | 52.3 /100 | #171 | Average 59.5% |
| Immigrants | Sierra Leone | 52.2 /100 | #172 | Average 59.5% |
| Immigrants | Oceania | 51.2 /100 | #173 | Average 59.4% |
| Celtics | 50.0 /100 | #174 | Average 59.4% |
| Sri Lankans | 49.0 /100 | #175 | Average 59.4% |
| Immigrants | Poland | 48.9 /100 | #176 | Average 59.4% |
| Tlingit-Haida | 48.4 /100 | #177 | Average 59.4% |
| Czechoslovakians | 48.3 /100 | #178 | Average 59.4% |
| Bermudans | 46.6 /100 | #179 | Average 59.3% |
| Yugoslavians | 44.1 /100 | #180 | Average 59.2% |
| Swiss | 43.4 /100 | #181 | Average 59.2% |
| Immigrants | Bosnia and Herzegovina | 42.8 /100 | #182 | Average 59.2% |
| German Russians | 39.3 /100 | #183 | Fair 59.1% |