White/Caucasian vs Australian Child Poverty Among Boys Under 16
COMPARE
White/Caucasian
Australian
Child Poverty Among Boys Under 16
Child Poverty Among Boys Under 16 Comparison
Whites/Caucasians
Australians
16.5%
CHILD POVERTY AMONG BOYS UNDER 16
48.2/ 100
METRIC RATING
176th/ 347
METRIC RANK
14.7%
CHILD POVERTY AMONG BOYS UNDER 16
98.0/ 100
METRIC RATING
74th/ 347
METRIC RANK
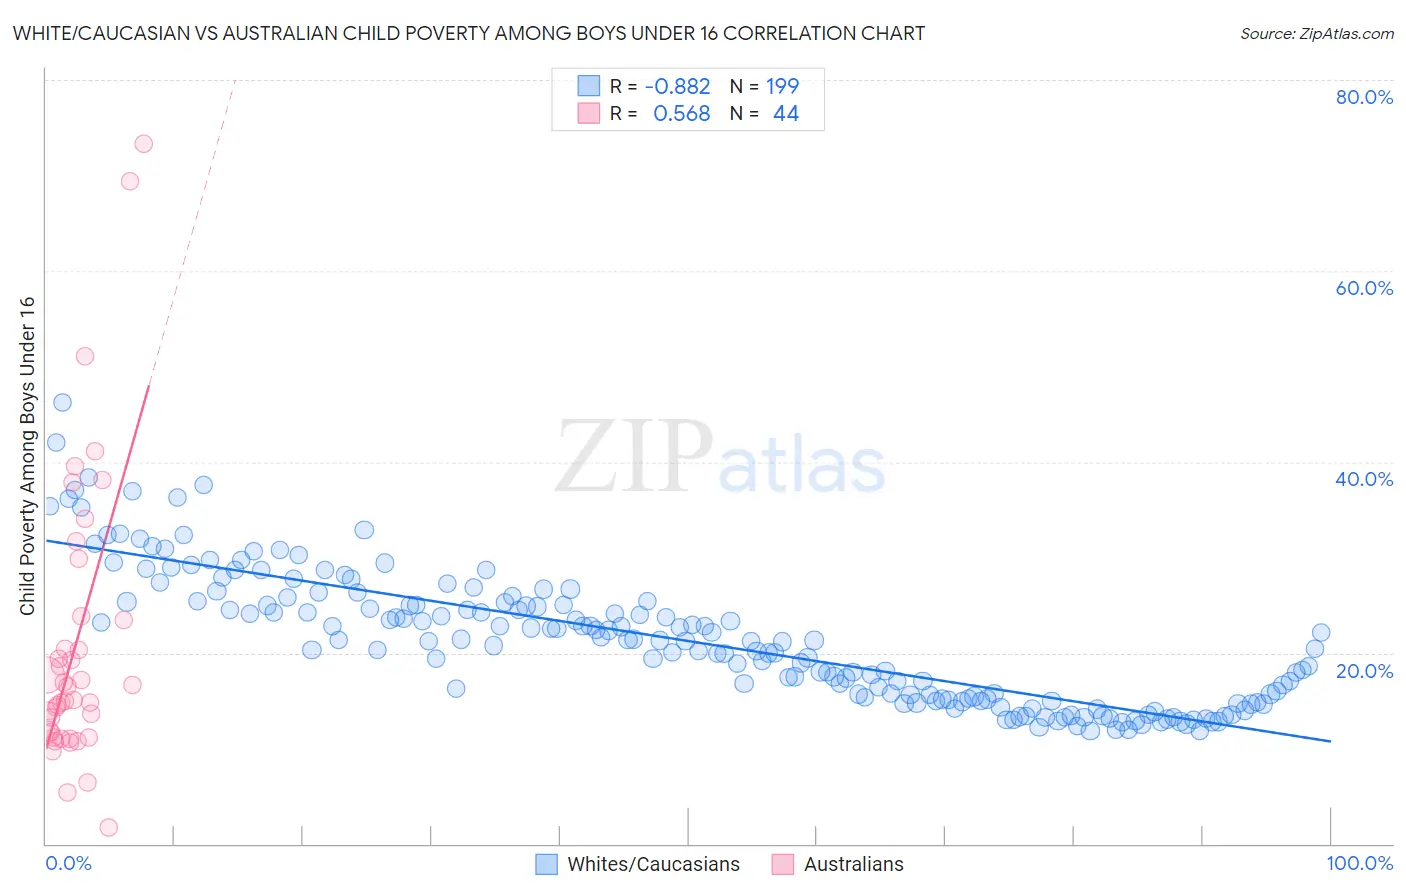
White/Caucasian vs Australian Child Poverty Among Boys Under 16 Correlation Chart
The statistical analysis conducted on geographies consisting of 560,435,427 people shows a very strong negative correlation between the proportion of Whites/Caucasians and poverty level among boys under the age of 16 in the United States with a correlation coefficient (R) of -0.882 and weighted average of 16.5%. Similarly, the statistical analysis conducted on geographies consisting of 221,429,706 people shows a substantial positive correlation between the proportion of Australians and poverty level among boys under the age of 16 in the United States with a correlation coefficient (R) of 0.568 and weighted average of 14.7%, a difference of 12.4%.
Child Poverty Among Boys Under 16 Correlation Summary
| Measurement | White/Caucasian | Australian |
| Minimum | 11.8% | 1.7% |
| Maximum | 46.2% | 73.3% |
| Range | 34.4% | 71.6% |
| Mean | 21.3% | 21.1% |
| Median | 21.2% | 15.8% |
| Interquartile 25% (IQ1) | 15.1% | 11.4% |
| Interquartile 75% (IQ3) | 25.3% | 23.6% |
| Interquartile Range (IQR) | 10.2% | 12.2% |
| Standard Deviation (Sample) | 6.9% | 15.3% |
| Standard Deviation (Population) | 6.9% | 15.1% |
Similar Demographics by Child Poverty Among Boys Under 16
Demographics Similar to Whites/Caucasians by Child Poverty Among Boys Under 16
In terms of child poverty among boys under 16, the demographic groups most similar to Whites/Caucasians are Ethiopian (16.5%, a difference of 0.040%), Scotch-Irish (16.5%, a difference of 0.080%), Immigrants from Syria (16.5%, a difference of 0.090%), Hungarian (16.5%, a difference of 0.10%), and Uruguayan (16.4%, a difference of 0.20%).
| Demographics | Rating | Rank | Child Poverty Among Boys Under 16 |
| Immigrants | Saudi Arabia | 53.6 /100 | #169 | Average 16.4% |
| Immigrants | Bosnia and Herzegovina | 51.7 /100 | #170 | Average 16.4% |
| Immigrants | Ethiopia | 51.3 /100 | #171 | Average 16.4% |
| Immigrants | Colombia | 50.8 /100 | #172 | Average 16.4% |
| Tsimshian | 50.5 /100 | #173 | Average 16.4% |
| Uruguayans | 50.0 /100 | #174 | Average 16.4% |
| Immigrants | Syria | 49.0 /100 | #175 | Average 16.5% |
| Whites/Caucasians | 48.2 /100 | #176 | Average 16.5% |
| Ethiopians | 47.8 /100 | #177 | Average 16.5% |
| Scotch-Irish | 47.5 /100 | #178 | Average 16.5% |
| Hungarians | 47.3 /100 | #179 | Average 16.5% |
| Hawaiians | 45.5 /100 | #180 | Average 16.5% |
| South American Indians | 44.3 /100 | #181 | Average 16.5% |
| Lebanese | 43.3 /100 | #182 | Average 16.6% |
| Kenyans | 41.0 /100 | #183 | Average 16.6% |
Demographics Similar to Australians by Child Poverty Among Boys Under 16
In terms of child poverty among boys under 16, the demographic groups most similar to Australians are Immigrants from Turkey (14.6%, a difference of 0.050%), Immigrants from Poland (14.7%, a difference of 0.070%), Immigrants from Latvia (14.6%, a difference of 0.10%), Immigrants from Netherlands (14.6%, a difference of 0.11%), and Immigrants from Croatia (14.7%, a difference of 0.13%).
| Demographics | Rating | Rank | Child Poverty Among Boys Under 16 |
| Immigrants | Europe | 98.4 /100 | #67 | Exceptional 14.5% |
| Slovenes | 98.4 /100 | #68 | Exceptional 14.5% |
| Immigrants | Austria | 98.4 /100 | #69 | Exceptional 14.5% |
| Europeans | 98.4 /100 | #70 | Exceptional 14.5% |
| Immigrants | Netherlands | 98.1 /100 | #71 | Exceptional 14.6% |
| Immigrants | Latvia | 98.1 /100 | #72 | Exceptional 14.6% |
| Immigrants | Turkey | 98.0 /100 | #73 | Exceptional 14.6% |
| Australians | 98.0 /100 | #74 | Exceptional 14.7% |
| Immigrants | Poland | 97.9 /100 | #75 | Exceptional 14.7% |
| Immigrants | Croatia | 97.9 /100 | #76 | Exceptional 14.7% |
| Macedonians | 97.9 /100 | #77 | Exceptional 14.7% |
| Egyptians | 97.8 /100 | #78 | Exceptional 14.7% |
| Immigrants | Eastern Europe | 97.8 /100 | #79 | Exceptional 14.7% |
| Immigrants | Russia | 97.7 /100 | #80 | Exceptional 14.7% |
| Immigrants | Canada | 97.6 /100 | #81 | Exceptional 14.7% |