Immigrants from South Central Asia vs Australian Householder Income Over 65 years
COMPARE
Immigrants from South Central Asia
Australian
Householder Income Over 65 years
Householder Income Over 65 years Comparison
Immigrants from South Central Asia
Australians
$70,103
HOUSEHOLDER INCOME OVER 65 YEARS
100.0/ 100
METRIC RATING
20th/ 347
METRIC RANK
$66,891
HOUSEHOLDER INCOME OVER 65 YEARS
99.8/ 100
METRIC RATING
47th/ 347
METRIC RANK
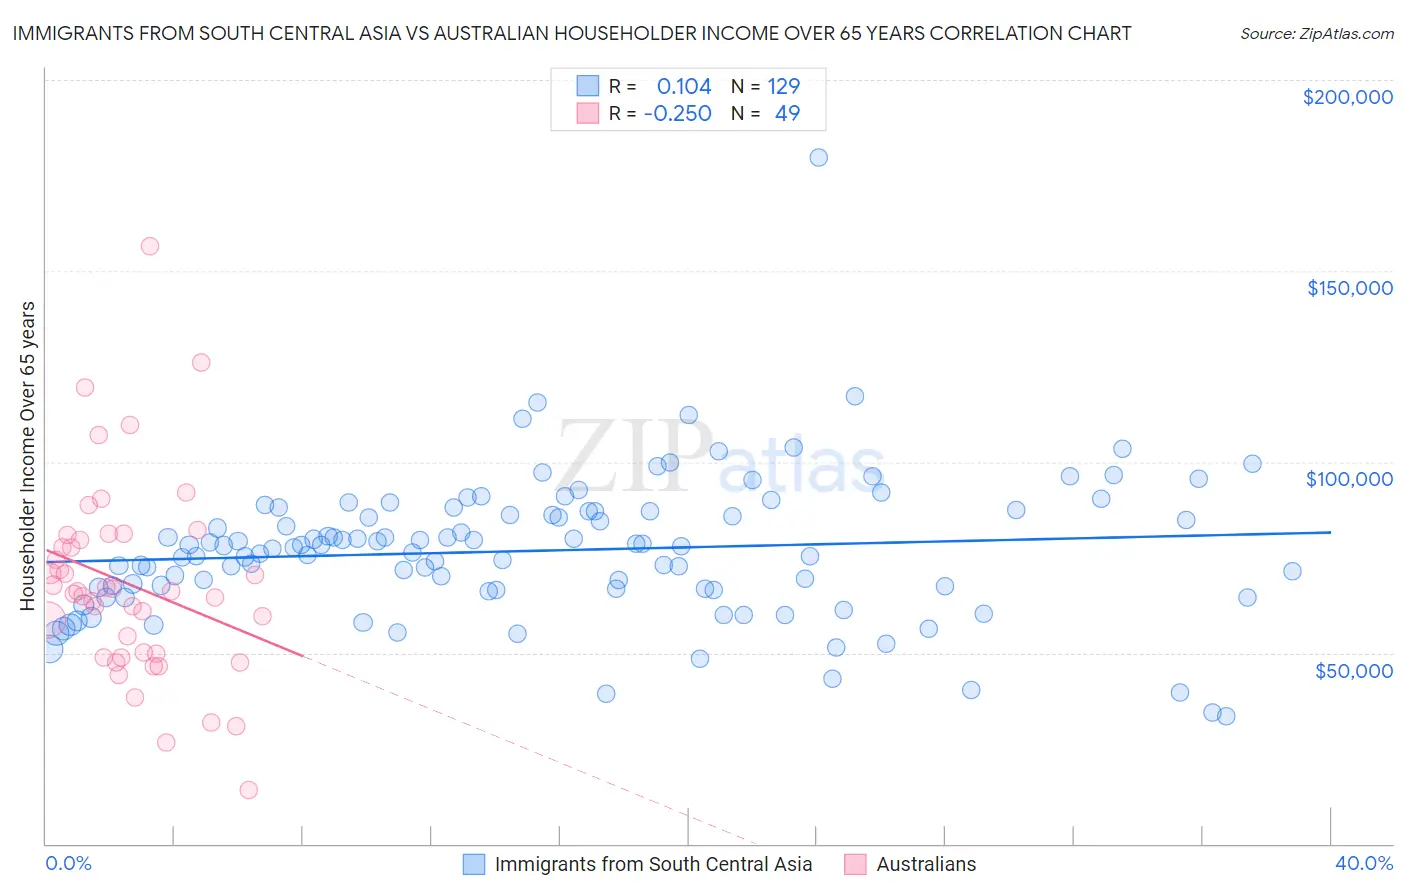
Immigrants from South Central Asia vs Australian Householder Income Over 65 years Correlation Chart
The statistical analysis conducted on geographies consisting of 470,970,472 people shows a poor positive correlation between the proportion of Immigrants from South Central Asia and household income with householder over the age of 65 in the United States with a correlation coefficient (R) of 0.104 and weighted average of $70,103. Similarly, the statistical analysis conducted on geographies consisting of 223,634,987 people shows a weak negative correlation between the proportion of Australians and household income with householder over the age of 65 in the United States with a correlation coefficient (R) of -0.250 and weighted average of $66,891, a difference of 4.8%.
Householder Income Over 65 years Correlation Summary
| Measurement | Immigrants from South Central Asia | Australian |
| Minimum | $33,500 | $13,929 |
| Maximum | $179,808 | $156,341 |
| Range | $146,308 | $142,412 |
| Mean | $76,705 | $67,933 |
| Median | $77,625 | $66,111 |
| Interquartile 25% (IQ1) | $66,593 | $49,254 |
| Interquartile 75% (IQ3) | $87,098 | $80,198 |
| Interquartile Range (IQR) | $20,505 | $30,944 |
| Standard Deviation (Sample) | $18,654 | $25,877 |
| Standard Deviation (Population) | $18,582 | $25,612 |
Similar Demographics by Householder Income Over 65 years
Demographics Similar to Immigrants from South Central Asia by Householder Income Over 65 years
In terms of householder income over 65 years, the demographic groups most similar to Immigrants from South Central Asia are Indian (Asian) ($70,238, a difference of 0.19%), Immigrants from Eastern Asia ($69,872, a difference of 0.33%), Immigrants from Israel ($69,857, a difference of 0.35%), Immigrants from Japan ($69,774, a difference of 0.47%), and Eastern European ($70,470, a difference of 0.52%).
| Demographics | Rating | Rank | Householder Income Over 65 years |
| Immigrants | Hong Kong | 100.0 /100 | #13 | Exceptional $71,567 |
| Burmese | 100.0 /100 | #14 | Exceptional $71,139 |
| Native Hawaiians | 100.0 /100 | #15 | Exceptional $71,021 |
| Okinawans | 100.0 /100 | #16 | Exceptional $70,846 |
| Immigrants | Korea | 100.0 /100 | #17 | Exceptional $70,696 |
| Eastern Europeans | 100.0 /100 | #18 | Exceptional $70,470 |
| Indians (Asian) | 100.0 /100 | #19 | Exceptional $70,238 |
| Immigrants | South Central Asia | 100.0 /100 | #20 | Exceptional $70,103 |
| Immigrants | Eastern Asia | 100.0 /100 | #21 | Exceptional $69,872 |
| Immigrants | Israel | 100.0 /100 | #22 | Exceptional $69,857 |
| Immigrants | Japan | 100.0 /100 | #23 | Exceptional $69,774 |
| Immigrants | Sweden | 100.0 /100 | #24 | Exceptional $69,722 |
| Immigrants | Belgium | 100.0 /100 | #25 | Exceptional $69,703 |
| Immigrants | Sri Lanka | 100.0 /100 | #26 | Exceptional $69,426 |
| Immigrants | Switzerland | 100.0 /100 | #27 | Exceptional $69,343 |
Demographics Similar to Australians by Householder Income Over 65 years
In terms of householder income over 65 years, the demographic groups most similar to Australians are Cambodian ($66,892, a difference of 0.0%), Immigrants from France ($66,826, a difference of 0.10%), Immigrants from Afghanistan ($67,007, a difference of 0.17%), Immigrants from Indonesia ($66,694, a difference of 0.29%), and Immigrants from Turkey ($66,672, a difference of 0.33%).
| Demographics | Rating | Rank | Householder Income Over 65 years |
| Immigrants | Asia | 99.9 /100 | #40 | Exceptional $67,594 |
| Koreans | 99.9 /100 | #41 | Exceptional $67,472 |
| New Zealanders | 99.9 /100 | #42 | Exceptional $67,333 |
| Latvians | 99.9 /100 | #43 | Exceptional $67,326 |
| Immigrants | South Africa | 99.9 /100 | #44 | Exceptional $67,234 |
| Immigrants | Afghanistan | 99.8 /100 | #45 | Exceptional $67,007 |
| Cambodians | 99.8 /100 | #46 | Exceptional $66,892 |
| Australians | 99.8 /100 | #47 | Exceptional $66,891 |
| Immigrants | France | 99.8 /100 | #48 | Exceptional $66,826 |
| Immigrants | Indonesia | 99.8 /100 | #49 | Exceptional $66,694 |
| Immigrants | Turkey | 99.7 /100 | #50 | Exceptional $66,672 |
| Israelis | 99.7 /100 | #51 | Exceptional $66,636 |
| Immigrants | Scotland | 99.7 /100 | #52 | Exceptional $66,620 |
| Immigrants | Pakistan | 99.7 /100 | #53 | Exceptional $66,617 |
| Immigrants | Netherlands | 99.7 /100 | #54 | Exceptional $66,463 |