Bulgarian vs Australian Householder Income Over 65 years
COMPARE
Bulgarian
Australian
Householder Income Over 65 years
Householder Income Over 65 years Comparison
Bulgarians
Australians
$66,236
HOUSEHOLDER INCOME OVER 65 YEARS
99.6/ 100
METRIC RATING
57th/ 347
METRIC RANK
$66,891
HOUSEHOLDER INCOME OVER 65 YEARS
99.8/ 100
METRIC RATING
47th/ 347
METRIC RANK
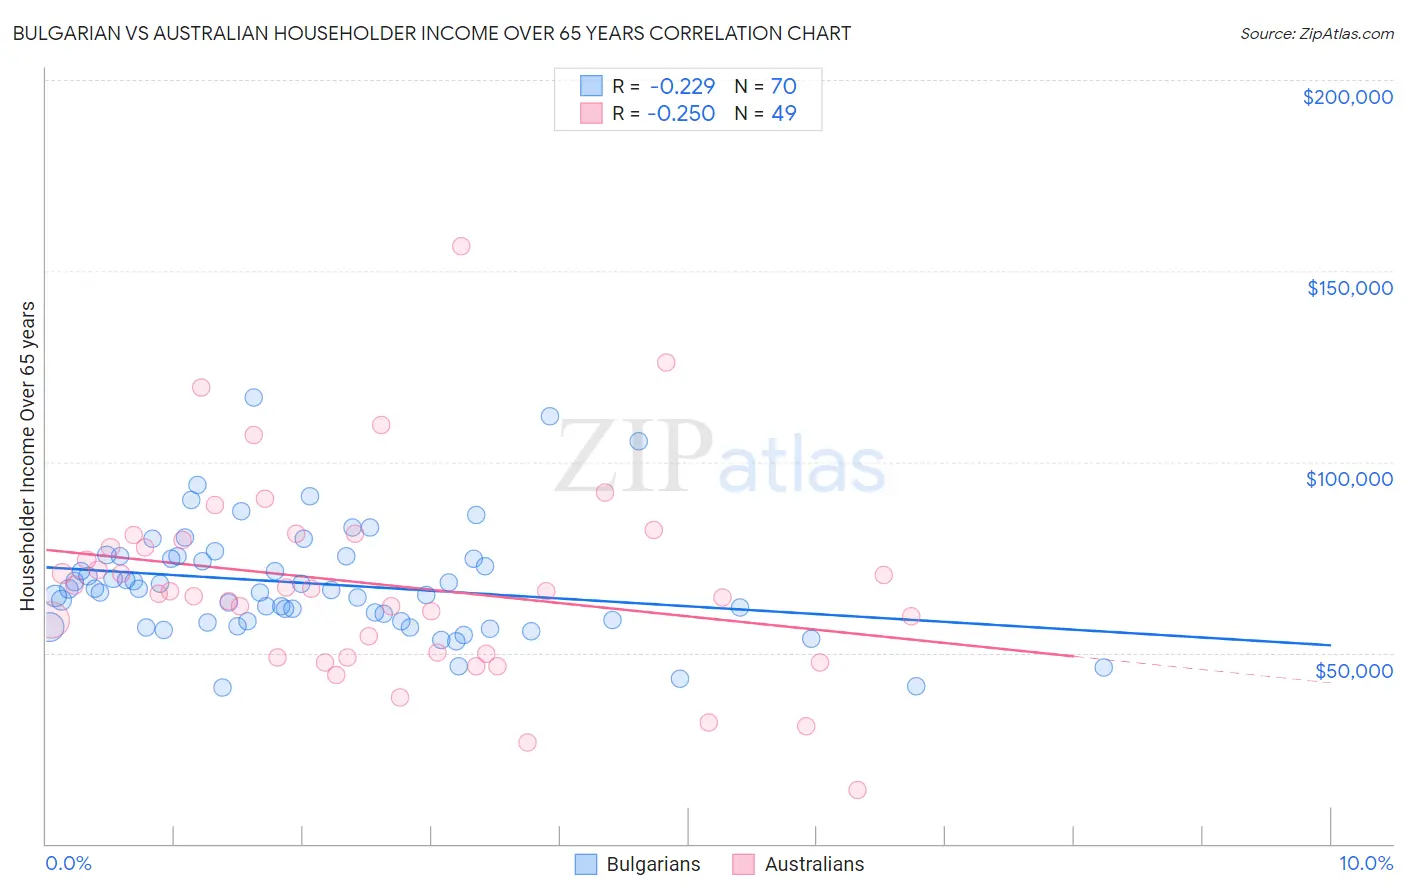
Bulgarian vs Australian Householder Income Over 65 years Correlation Chart
The statistical analysis conducted on geographies consisting of 205,399,104 people shows a weak negative correlation between the proportion of Bulgarians and household income with householder over the age of 65 in the United States with a correlation coefficient (R) of -0.229 and weighted average of $66,236. Similarly, the statistical analysis conducted on geographies consisting of 223,634,987 people shows a weak negative correlation between the proportion of Australians and household income with householder over the age of 65 in the United States with a correlation coefficient (R) of -0.250 and weighted average of $66,891, a difference of 0.99%.
Householder Income Over 65 years Correlation Summary
| Measurement | Bulgarian | Australian |
| Minimum | $40,918 | $13,929 |
| Maximum | $116,874 | $156,341 |
| Range | $75,956 | $142,412 |
| Mean | $68,096 | $67,933 |
| Median | $66,678 | $66,111 |
| Interquartile 25% (IQ1) | $58,125 | $49,254 |
| Interquartile 75% (IQ3) | $75,296 | $80,198 |
| Interquartile Range (IQR) | $17,171 | $30,944 |
| Standard Deviation (Sample) | $14,736 | $25,877 |
| Standard Deviation (Population) | $14,630 | $25,612 |
Demographics Similar to Bulgarians and Australians by Householder Income Over 65 years
In terms of householder income over 65 years, the demographic groups most similar to Bulgarians are Laotian ($66,306, a difference of 0.11%), Immigrants from Philippines ($66,161, a difference of 0.11%), Immigrants from Norway ($66,118, a difference of 0.18%), Immigrants from Czechoslovakia ($66,376, a difference of 0.21%), and Immigrants from Lithuania ($66,087, a difference of 0.22%). Similarly, the demographic groups most similar to Australians are Cambodian ($66,892, a difference of 0.0%), Immigrants from France ($66,826, a difference of 0.10%), Immigrants from Afghanistan ($67,007, a difference of 0.17%), Immigrants from Indonesia ($66,694, a difference of 0.29%), and Immigrants from Turkey ($66,672, a difference of 0.33%).
| Demographics | Rating | Rank | Householder Income Over 65 years |
| New Zealanders | 99.9 /100 | #42 | Exceptional $67,333 |
| Latvians | 99.9 /100 | #43 | Exceptional $67,326 |
| Immigrants | South Africa | 99.9 /100 | #44 | Exceptional $67,234 |
| Immigrants | Afghanistan | 99.8 /100 | #45 | Exceptional $67,007 |
| Cambodians | 99.8 /100 | #46 | Exceptional $66,892 |
| Australians | 99.8 /100 | #47 | Exceptional $66,891 |
| Immigrants | France | 99.8 /100 | #48 | Exceptional $66,826 |
| Immigrants | Indonesia | 99.8 /100 | #49 | Exceptional $66,694 |
| Immigrants | Turkey | 99.7 /100 | #50 | Exceptional $66,672 |
| Israelis | 99.7 /100 | #51 | Exceptional $66,636 |
| Immigrants | Scotland | 99.7 /100 | #52 | Exceptional $66,620 |
| Immigrants | Pakistan | 99.7 /100 | #53 | Exceptional $66,617 |
| Immigrants | Netherlands | 99.7 /100 | #54 | Exceptional $66,463 |
| Immigrants | Czechoslovakia | 99.7 /100 | #55 | Exceptional $66,376 |
| Laotians | 99.6 /100 | #56 | Exceptional $66,306 |
| Bulgarians | 99.6 /100 | #57 | Exceptional $66,236 |
| Immigrants | Philippines | 99.6 /100 | #58 | Exceptional $66,161 |
| Immigrants | Norway | 99.5 /100 | #59 | Exceptional $66,118 |
| Immigrants | Lithuania | 99.5 /100 | #60 | Exceptional $66,087 |
| Maltese | 99.5 /100 | #61 | Exceptional $66,027 |
| Immigrants | Sierra Leone | 99.5 /100 | #62 | Exceptional $66,009 |