Czechoslovakian vs Argentinean Householder Income Under 25 years
COMPARE
Czechoslovakian
Argentinean
Householder Income Under 25 years
Householder Income Under 25 years Comparison
Czechoslovakians
Argentineans
$51,224
HOUSEHOLDER INCOME UNDER 25 YEARS
8.6/ 100
METRIC RATING
217th/ 347
METRIC RANK
$54,154
HOUSEHOLDER INCOME UNDER 25 YEARS
99.2/ 100
METRIC RATING
96th/ 347
METRIC RANK
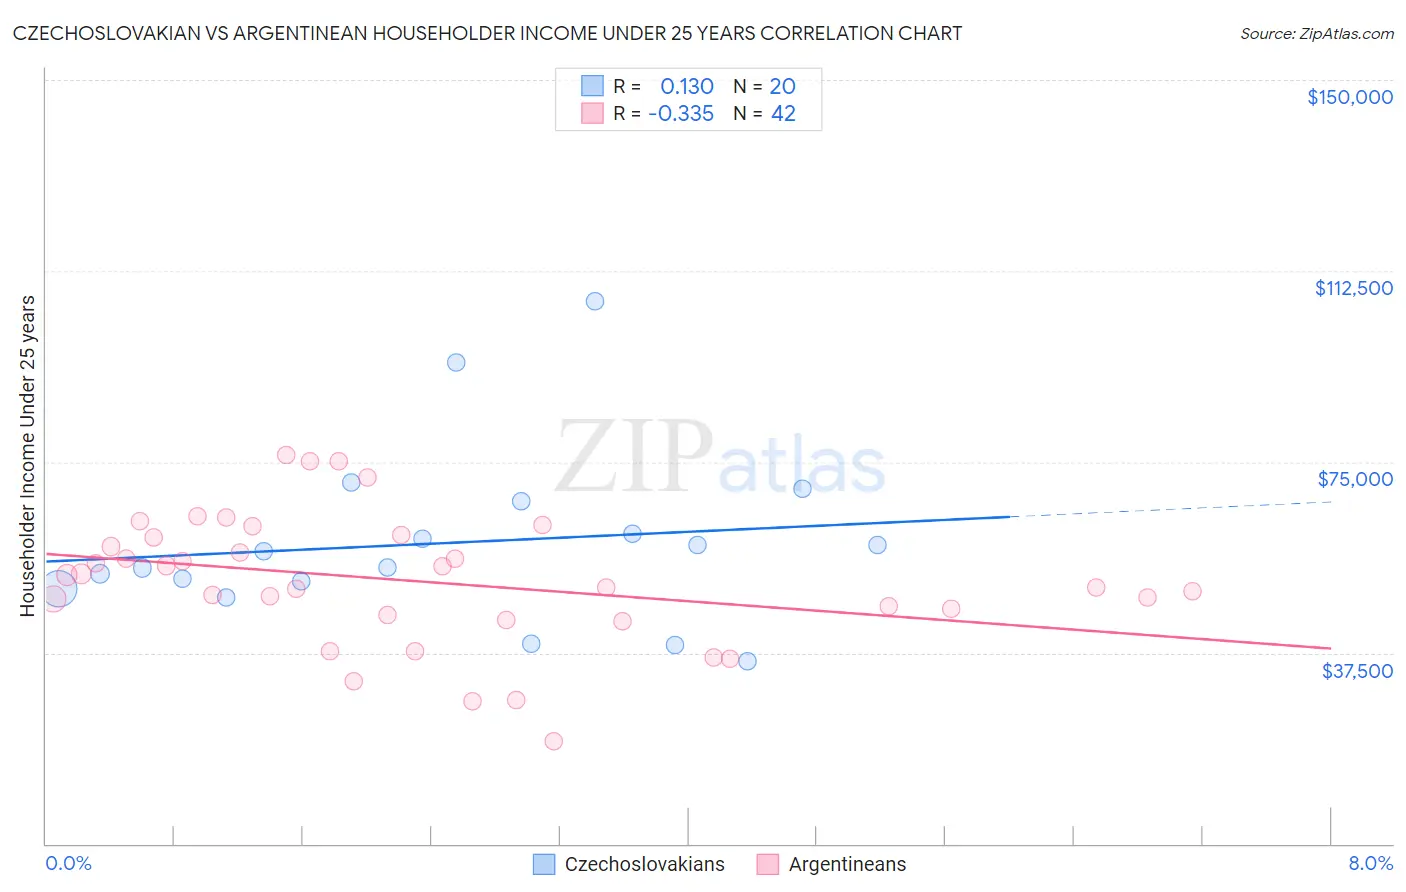
Czechoslovakian vs Argentinean Householder Income Under 25 years Correlation Chart
The statistical analysis conducted on geographies consisting of 311,218,514 people shows a poor positive correlation between the proportion of Czechoslovakians and household income with householder under the age of 25 in the United States with a correlation coefficient (R) of 0.130 and weighted average of $51,224. Similarly, the statistical analysis conducted on geographies consisting of 257,126,127 people shows a mild negative correlation between the proportion of Argentineans and household income with householder under the age of 25 in the United States with a correlation coefficient (R) of -0.335 and weighted average of $54,154, a difference of 5.7%.
Householder Income Under 25 years Correlation Summary
| Measurement | Czechoslovakian | Argentinean |
| Minimum | $35,781 | $20,094 |
| Maximum | $106,448 | $76,444 |
| Range | $70,667 | $56,350 |
| Mean | $59,100 | $51,569 |
| Median | $55,865 | $51,595 |
| Interquartile 25% (IQ1) | $50,876 | $44,853 |
| Interquartile 75% (IQ3) | $64,106 | $60,142 |
| Interquartile Range (IQR) | $13,231 | $15,290 |
| Standard Deviation (Sample) | $17,072 | $12,822 |
| Standard Deviation (Population) | $16,639 | $12,668 |
Similar Demographics by Householder Income Under 25 years
Demographics Similar to Czechoslovakians by Householder Income Under 25 years
In terms of householder income under 25 years, the demographic groups most similar to Czechoslovakians are Immigrants from Belize ($51,223, a difference of 0.0%), French ($51,230, a difference of 0.010%), Arab ($51,219, a difference of 0.010%), Icelander ($51,247, a difference of 0.050%), and Zimbabwean ($51,259, a difference of 0.070%).
| Demographics | Rating | Rank | Householder Income Under 25 years |
| Immigrants | Ghana | 10.9 /100 | #210 | Poor $51,333 |
| Irish | 10.6 /100 | #211 | Poor $51,317 |
| Immigrants | Panama | 9.7 /100 | #212 | Tragic $51,278 |
| Dutch | 9.4 /100 | #213 | Tragic $51,265 |
| Zimbabweans | 9.3 /100 | #214 | Tragic $51,259 |
| Icelanders | 9.1 /100 | #215 | Tragic $51,247 |
| French | 8.7 /100 | #216 | Tragic $51,230 |
| Czechoslovakians | 8.6 /100 | #217 | Tragic $51,224 |
| Immigrants | Belize | 8.6 /100 | #218 | Tragic $51,223 |
| Arabs | 8.5 /100 | #219 | Tragic $51,219 |
| Immigrants | Germany | 8.0 /100 | #220 | Tragic $51,190 |
| Immigrants | Eastern Africa | 7.4 /100 | #221 | Tragic $51,158 |
| Spaniards | 6.8 /100 | #222 | Tragic $51,117 |
| Serbians | 6.6 /100 | #223 | Tragic $51,106 |
| Belizeans | 6.4 /100 | #224 | Tragic $51,094 |
Demographics Similar to Argentineans by Householder Income Under 25 years
In terms of householder income under 25 years, the demographic groups most similar to Argentineans are Immigrants from Malaysia ($54,179, a difference of 0.050%), Immigrants from Sierra Leone ($54,190, a difference of 0.070%), Immigrants from Portugal ($54,105, a difference of 0.090%), Immigrants from Argentina ($54,209, a difference of 0.10%), and Immigrants from St. Vincent and the Grenadines ($54,230, a difference of 0.14%).
| Demographics | Rating | Rank | Householder Income Under 25 years |
| Immigrants | South America | 99.4 /100 | #89 | Exceptional $54,268 |
| Turks | 99.4 /100 | #90 | Exceptional $54,266 |
| Immigrants | Egypt | 99.3 /100 | #91 | Exceptional $54,239 |
| Immigrants | St. Vincent and the Grenadines | 99.3 /100 | #92 | Exceptional $54,230 |
| Immigrants | Argentina | 99.3 /100 | #93 | Exceptional $54,209 |
| Immigrants | Sierra Leone | 99.3 /100 | #94 | Exceptional $54,190 |
| Immigrants | Malaysia | 99.2 /100 | #95 | Exceptional $54,179 |
| Argentineans | 99.2 /100 | #96 | Exceptional $54,154 |
| Immigrants | Portugal | 99.1 /100 | #97 | Exceptional $54,105 |
| Eastern Europeans | 99.0 /100 | #98 | Exceptional $54,066 |
| Alaska Natives | 98.8 /100 | #99 | Exceptional $54,000 |
| Immigrants | Kazakhstan | 98.8 /100 | #100 | Exceptional $53,990 |
| South Americans | 98.6 /100 | #101 | Exceptional $53,939 |
| Ecuadorians | 98.5 /100 | #102 | Exceptional $53,911 |
| Ukrainians | 98.3 /100 | #103 | Exceptional $53,843 |