White/Caucasian vs Argentinean Unemployment
COMPARE
White/Caucasian
Argentinean
Unemployment
Unemployment Comparison
Whites/Caucasians
Argentineans
4.9%
UNEMPLOYMENT
99.2/ 100
METRIC RATING
52nd/ 347
METRIC RANK
5.1%
UNEMPLOYMENT
92.4/ 100
METRIC RATING
113th/ 347
METRIC RANK
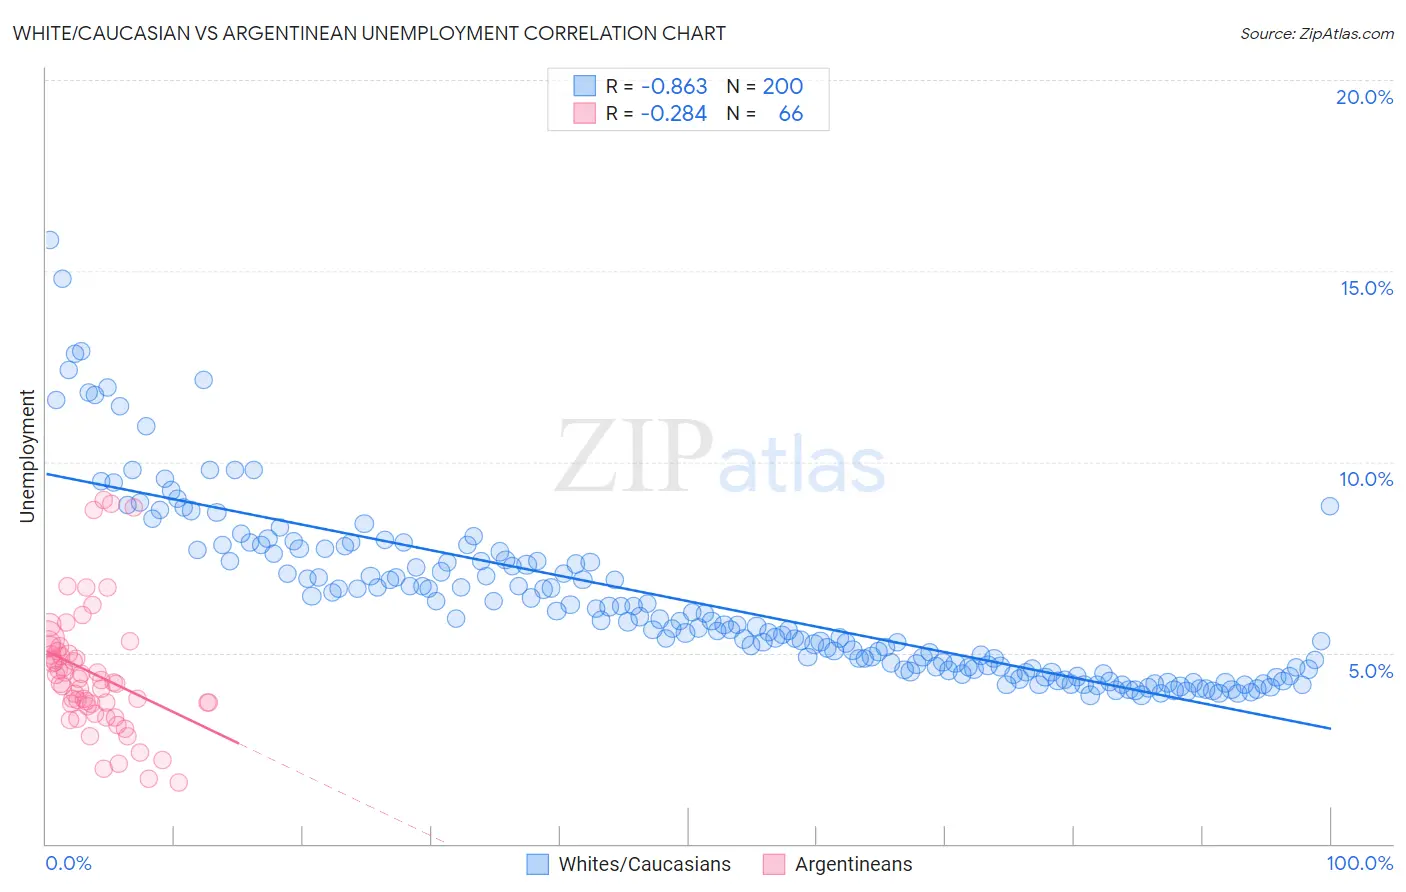
White/Caucasian vs Argentinean Unemployment Correlation Chart
The statistical analysis conducted on geographies consisting of 578,869,025 people shows a very strong negative correlation between the proportion of Whites/Caucasians and unemployment in the United States with a correlation coefficient (R) of -0.863 and weighted average of 4.9%. Similarly, the statistical analysis conducted on geographies consisting of 297,046,481 people shows a weak negative correlation between the proportion of Argentineans and unemployment in the United States with a correlation coefficient (R) of -0.284 and weighted average of 5.1%, a difference of 3.9%.
Unemployment Correlation Summary
| Measurement | White/Caucasian | Argentinean |
| Minimum | 3.9% | 1.6% |
| Maximum | 15.8% | 9.0% |
| Range | 11.9% | 7.4% |
| Mean | 6.3% | 4.5% |
| Median | 5.8% | 4.3% |
| Interquartile 25% (IQ1) | 4.6% | 3.7% |
| Interquartile 75% (IQ3) | 7.4% | 5.0% |
| Interquartile Range (IQR) | 2.8% | 1.4% |
| Standard Deviation (Sample) | 2.2% | 1.6% |
| Standard Deviation (Population) | 2.2% | 1.6% |
Similar Demographics by Unemployment
Demographics Similar to Whites/Caucasians by Unemployment
In terms of unemployment, the demographic groups most similar to Whites/Caucasians are Immigrants from Belgium (4.9%, a difference of 0.010%), Immigrants from Zimbabwe (4.9%, a difference of 0.030%), Eastern European (4.9%, a difference of 0.060%), Australian (4.9%, a difference of 0.090%), and French Canadian (4.9%, a difference of 0.17%).
| Demographics | Rating | Rank | Unemployment |
| French | 99.5 /100 | #45 | Exceptional 4.8% |
| Immigrants | Nepal | 99.4 /100 | #46 | Exceptional 4.8% |
| Immigrants | Taiwan | 99.4 /100 | #47 | Exceptional 4.8% |
| Immigrants | Scotland | 99.3 /100 | #48 | Exceptional 4.9% |
| Immigrants | South Central Asia | 99.3 /100 | #49 | Exceptional 4.9% |
| French Canadians | 99.3 /100 | #50 | Exceptional 4.9% |
| Immigrants | Belgium | 99.2 /100 | #51 | Exceptional 4.9% |
| Whites/Caucasians | 99.2 /100 | #52 | Exceptional 4.9% |
| Immigrants | Zimbabwe | 99.2 /100 | #53 | Exceptional 4.9% |
| Eastern Europeans | 99.2 /100 | #54 | Exceptional 4.9% |
| Australians | 99.2 /100 | #55 | Exceptional 4.9% |
| Celtics | 99.1 /100 | #56 | Exceptional 4.9% |
| Immigrants | Singapore | 99.1 /100 | #57 | Exceptional 4.9% |
| Greeks | 99.0 /100 | #58 | Exceptional 4.9% |
| Bhutanese | 99.0 /100 | #59 | Exceptional 4.9% |
Demographics Similar to Argentineans by Unemployment
In terms of unemployment, the demographic groups most similar to Argentineans are South African (5.1%, a difference of 0.040%), Immigrants from Ireland (5.1%, a difference of 0.060%), Immigrants from Lithuania (5.0%, a difference of 0.19%), Chilean (5.0%, a difference of 0.19%), and Immigrants from Eritrea (5.0%, a difference of 0.21%).
| Demographics | Rating | Rank | Unemployment |
| Immigrants | Romania | 93.7 /100 | #106 | Exceptional 5.0% |
| Immigrants | Turkey | 93.7 /100 | #107 | Exceptional 5.0% |
| Immigrants | Kuwait | 93.7 /100 | #108 | Exceptional 5.0% |
| Immigrants | Eritrea | 93.3 /100 | #109 | Exceptional 5.0% |
| Immigrants | Lithuania | 93.2 /100 | #110 | Exceptional 5.0% |
| Chileans | 93.2 /100 | #111 | Exceptional 5.0% |
| South Africans | 92.6 /100 | #112 | Exceptional 5.1% |
| Argentineans | 92.4 /100 | #113 | Exceptional 5.1% |
| Immigrants | Ireland | 92.1 /100 | #114 | Exceptional 5.1% |
| Immigrants | Western Europe | 91.1 /100 | #115 | Exceptional 5.1% |
| Immigrants | Sri Lanka | 91.1 /100 | #116 | Exceptional 5.1% |
| Immigrants | Malaysia | 91.0 /100 | #117 | Exceptional 5.1% |
| Immigrants | Germany | 90.8 /100 | #118 | Exceptional 5.1% |
| Immigrants | France | 89.7 /100 | #119 | Excellent 5.1% |
| Macedonians | 89.7 /100 | #120 | Excellent 5.1% |