Assyrian/Chaldean/Syriac vs Argentinean Householder Income Under 25 years
COMPARE
Assyrian/Chaldean/Syriac
Argentinean
Householder Income Under 25 years
Householder Income Under 25 years Comparison
Assyrians/Chaldeans/Syriacs
Argentineans
$65,329
HOUSEHOLDER INCOME UNDER 25 YEARS
100.0/ 100
METRIC RATING
1st/ 347
METRIC RANK
$54,154
HOUSEHOLDER INCOME UNDER 25 YEARS
99.2/ 100
METRIC RATING
96th/ 347
METRIC RANK
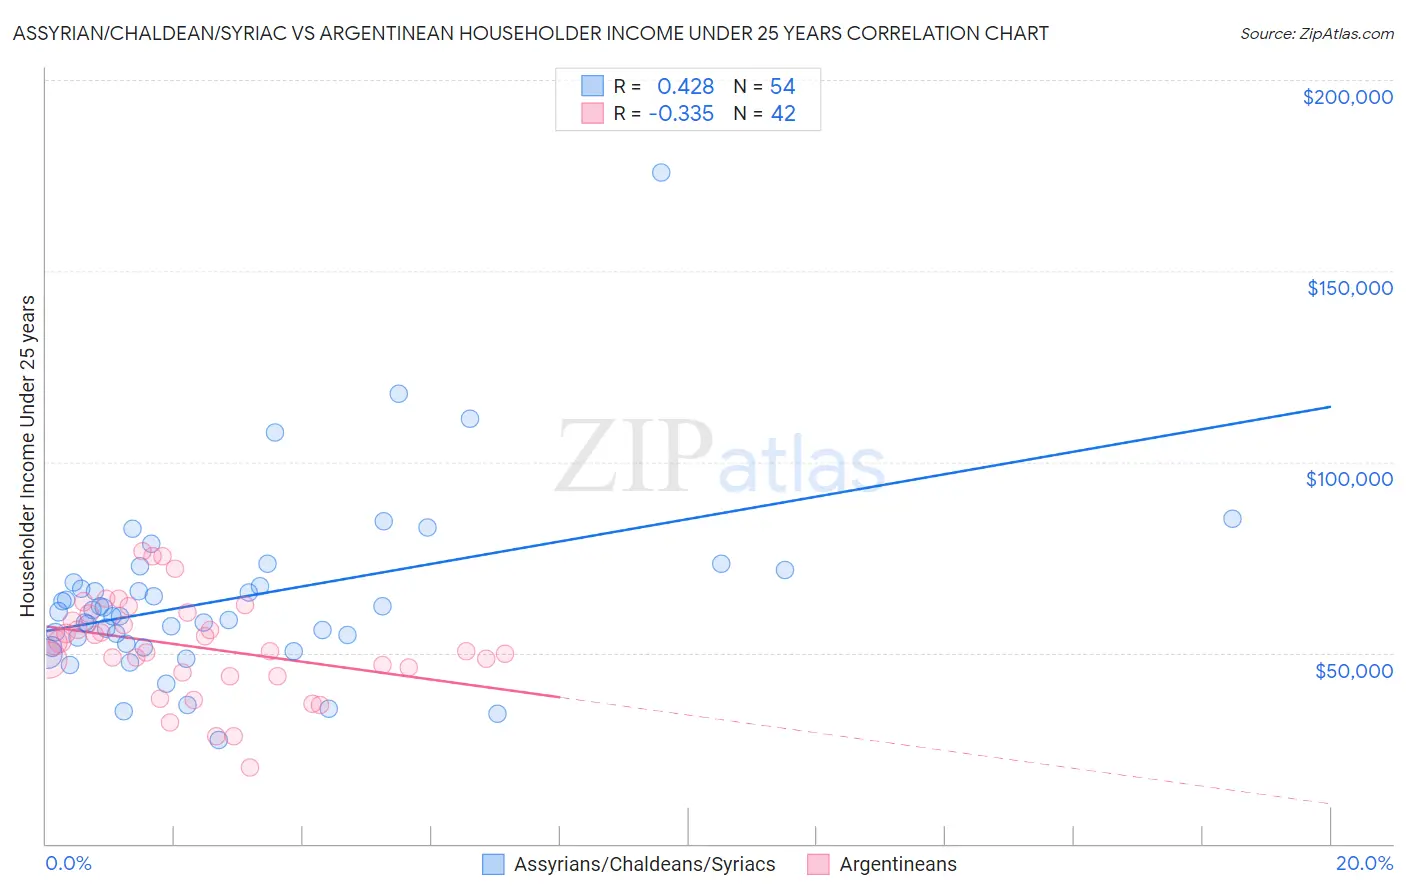
Assyrian/Chaldean/Syriac vs Argentinean Householder Income Under 25 years Correlation Chart
The statistical analysis conducted on geographies consisting of 100,770,753 people shows a moderate positive correlation between the proportion of Assyrians/Chaldeans/Syriacs and household income with householder under the age of 25 in the United States with a correlation coefficient (R) of 0.428 and weighted average of $65,329. Similarly, the statistical analysis conducted on geographies consisting of 257,126,127 people shows a mild negative correlation between the proportion of Argentineans and household income with householder under the age of 25 in the United States with a correlation coefficient (R) of -0.335 and weighted average of $54,154, a difference of 20.6%.
Householder Income Under 25 years Correlation Summary
| Measurement | Assyrian/Chaldean/Syriac | Argentinean |
| Minimum | $27,045 | $20,094 |
| Maximum | $175,865 | $76,444 |
| Range | $148,820 | $56,350 |
| Mean | $64,201 | $51,569 |
| Median | $60,126 | $51,595 |
| Interquartile 25% (IQ1) | $52,453 | $44,853 |
| Interquartile 75% (IQ3) | $68,319 | $60,142 |
| Interquartile Range (IQR) | $15,866 | $15,290 |
| Standard Deviation (Sample) | $23,487 | $12,822 |
| Standard Deviation (Population) | $23,269 | $12,668 |
Similar Demographics by Householder Income Under 25 years
Demographics Similar to Assyrians/Chaldeans/Syriacs by Householder Income Under 25 years
In terms of householder income under 25 years, the demographic groups most similar to Assyrians/Chaldeans/Syriacs are Immigrants from Hong Kong ($62,083, a difference of 5.2%), Immigrants from India ($59,914, a difference of 9.0%), Immigrants from Taiwan ($59,424, a difference of 9.9%), Immigrants from Bolivia ($59,389, a difference of 10.0%), and Thai ($59,187, a difference of 10.4%).
| Demographics | Rating | Rank | Householder Income Under 25 years |
| Assyrians/Chaldeans/Syriacs | 100.0 /100 | #1 | Exceptional $65,329 |
| Immigrants | Hong Kong | 100.0 /100 | #2 | Exceptional $62,083 |
| Immigrants | India | 100.0 /100 | #3 | Exceptional $59,914 |
| Immigrants | Taiwan | 100.0 /100 | #4 | Exceptional $59,424 |
| Immigrants | Bolivia | 100.0 /100 | #5 | Exceptional $59,389 |
| Thais | 100.0 /100 | #6 | Exceptional $59,187 |
| Bolivians | 100.0 /100 | #7 | Exceptional $58,506 |
| Indians (Asian) | 100.0 /100 | #8 | Exceptional $58,239 |
| Chinese | 100.0 /100 | #9 | Exceptional $58,162 |
| Afghans | 100.0 /100 | #10 | Exceptional $58,019 |
| Immigrants | China | 100.0 /100 | #11 | Exceptional $57,931 |
| Immigrants | Philippines | 100.0 /100 | #12 | Exceptional $57,930 |
| Immigrants | South Central Asia | 100.0 /100 | #13 | Exceptional $57,818 |
| Filipinos | 100.0 /100 | #14 | Exceptional $57,740 |
| Koreans | 100.0 /100 | #15 | Exceptional $57,730 |
Demographics Similar to Argentineans by Householder Income Under 25 years
In terms of householder income under 25 years, the demographic groups most similar to Argentineans are Immigrants from Malaysia ($54,179, a difference of 0.050%), Immigrants from Sierra Leone ($54,190, a difference of 0.070%), Immigrants from Portugal ($54,105, a difference of 0.090%), Immigrants from Argentina ($54,209, a difference of 0.10%), and Immigrants from St. Vincent and the Grenadines ($54,230, a difference of 0.14%).
| Demographics | Rating | Rank | Householder Income Under 25 years |
| Immigrants | South America | 99.4 /100 | #89 | Exceptional $54,268 |
| Turks | 99.4 /100 | #90 | Exceptional $54,266 |
| Immigrants | Egypt | 99.3 /100 | #91 | Exceptional $54,239 |
| Immigrants | St. Vincent and the Grenadines | 99.3 /100 | #92 | Exceptional $54,230 |
| Immigrants | Argentina | 99.3 /100 | #93 | Exceptional $54,209 |
| Immigrants | Sierra Leone | 99.3 /100 | #94 | Exceptional $54,190 |
| Immigrants | Malaysia | 99.2 /100 | #95 | Exceptional $54,179 |
| Argentineans | 99.2 /100 | #96 | Exceptional $54,154 |
| Immigrants | Portugal | 99.1 /100 | #97 | Exceptional $54,105 |
| Eastern Europeans | 99.0 /100 | #98 | Exceptional $54,066 |
| Alaska Natives | 98.8 /100 | #99 | Exceptional $54,000 |
| Immigrants | Kazakhstan | 98.8 /100 | #100 | Exceptional $53,990 |
| South Americans | 98.6 /100 | #101 | Exceptional $53,939 |
| Ecuadorians | 98.5 /100 | #102 | Exceptional $53,911 |
| Ukrainians | 98.3 /100 | #103 | Exceptional $53,843 |