Vietnamese vs Immigrants from Honduras 10th Grade
COMPARE
Vietnamese
Immigrants from Honduras
10th Grade
10th Grade Comparison
Vietnamese
Immigrants from Honduras
90.9%
10TH GRADE
0.0/ 100
METRIC RATING
310th/ 347
METRIC RANK
88.5%
10TH GRADE
0.0/ 100
METRIC RATING
336th/ 347
METRIC RANK
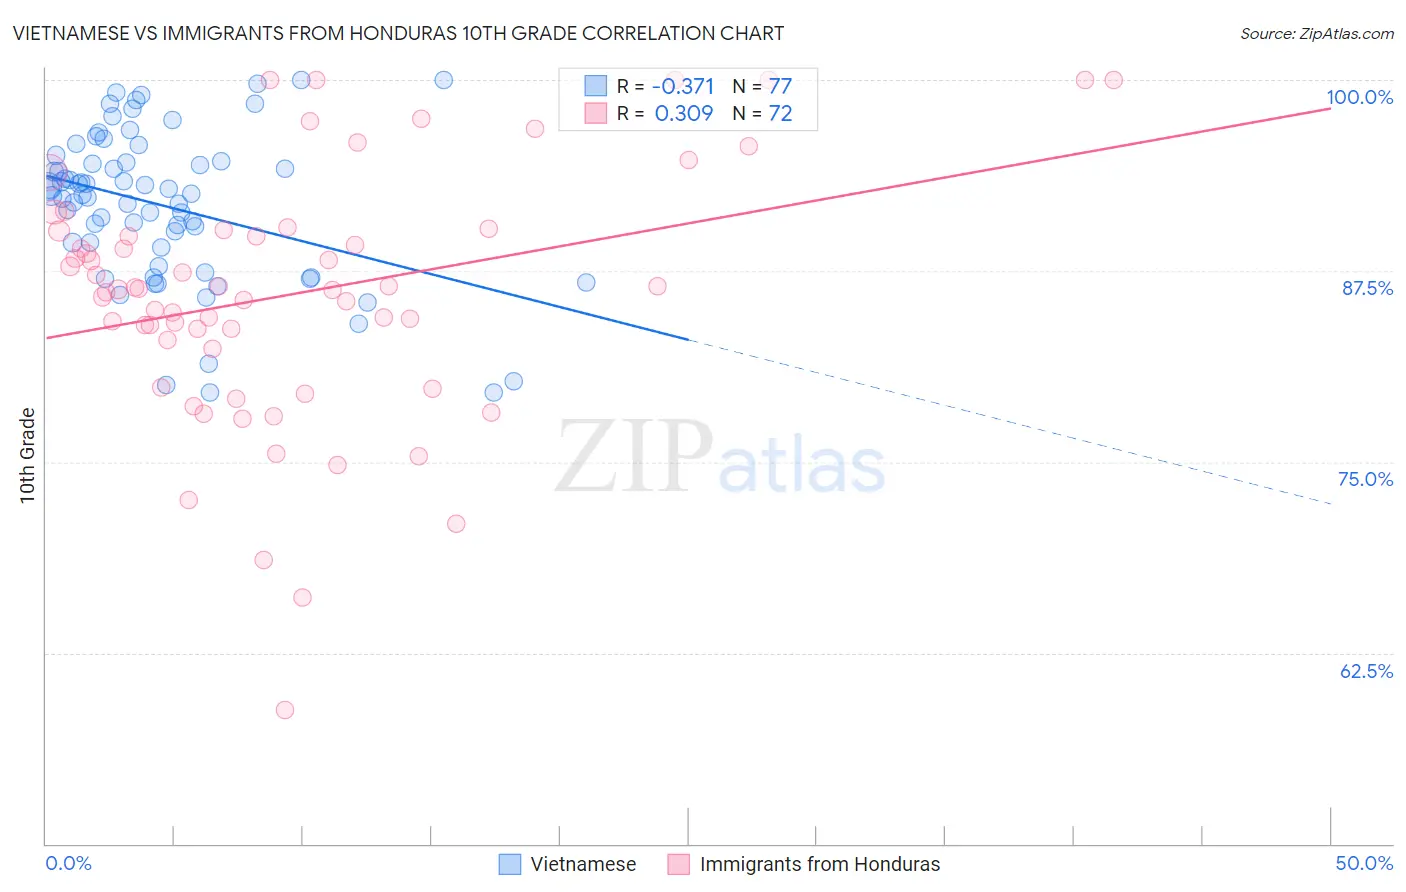
Vietnamese vs Immigrants from Honduras 10th Grade Correlation Chart
The statistical analysis conducted on geographies consisting of 170,728,240 people shows a mild negative correlation between the proportion of Vietnamese and percentage of population with at least 10th grade education in the United States with a correlation coefficient (R) of -0.371 and weighted average of 90.9%. Similarly, the statistical analysis conducted on geographies consisting of 322,637,445 people shows a mild positive correlation between the proportion of Immigrants from Honduras and percentage of population with at least 10th grade education in the United States with a correlation coefficient (R) of 0.309 and weighted average of 88.5%, a difference of 2.7%.
10th Grade Correlation Summary
| Measurement | Vietnamese | Immigrants from Honduras |
| Minimum | 79.5% | 58.7% |
| Maximum | 100.0% | 100.0% |
| Range | 20.5% | 41.3% |
| Mean | 91.8% | 86.0% |
| Median | 92.5% | 86.3% |
| Interquartile 25% (IQ1) | 88.4% | 82.7% |
| Interquartile 75% (IQ3) | 94.6% | 90.2% |
| Interquartile Range (IQR) | 6.2% | 7.5% |
| Standard Deviation (Sample) | 5.0% | 8.2% |
| Standard Deviation (Population) | 4.9% | 8.2% |
Similar Demographics by 10th Grade
Demographics Similar to Vietnamese by 10th Grade
In terms of 10th grade, the demographic groups most similar to Vietnamese are Immigrants from Cambodia (90.9%, a difference of 0.020%), Immigrants (91.0%, a difference of 0.040%), Immigrants from Bangladesh (91.0%, a difference of 0.080%), Immigrants from Fiji (91.0%, a difference of 0.090%), and Yaqui (91.1%, a difference of 0.15%).
| Demographics | Rating | Rank | 10th Grade |
| Immigrants | Vietnam | 0.0 /100 | #303 | Tragic 91.2% |
| Pima | 0.0 /100 | #304 | Tragic 91.2% |
| Immigrants | Dominica | 0.0 /100 | #305 | Tragic 91.1% |
| Yaqui | 0.0 /100 | #306 | Tragic 91.1% |
| Immigrants | Fiji | 0.0 /100 | #307 | Tragic 91.0% |
| Immigrants | Bangladesh | 0.0 /100 | #308 | Tragic 91.0% |
| Immigrants | Immigrants | 0.0 /100 | #309 | Tragic 91.0% |
| Vietnamese | 0.0 /100 | #310 | Tragic 90.9% |
| Immigrants | Cambodia | 0.0 /100 | #311 | Tragic 90.9% |
| Immigrants | Portugal | 0.0 /100 | #312 | Tragic 90.8% |
| Cape Verdeans | 0.0 /100 | #313 | Tragic 90.8% |
| Nepalese | 0.0 /100 | #314 | Tragic 90.7% |
| Immigrants | Caribbean | 0.0 /100 | #315 | Tragic 90.6% |
| Ecuadorians | 0.0 /100 | #316 | Tragic 90.6% |
| Immigrants | Ecuador | 0.0 /100 | #317 | Tragic 90.4% |
Demographics Similar to Immigrants from Honduras by 10th Grade
In terms of 10th grade, the demographic groups most similar to Immigrants from Honduras are Central American (88.4%, a difference of 0.15%), Immigrants from Dominican Republic (88.7%, a difference of 0.19%), Immigrants from Latin America (88.3%, a difference of 0.21%), Hispanic or Latino (88.9%, a difference of 0.37%), and Honduran (89.0%, a difference of 0.49%).
| Demographics | Rating | Rank | 10th Grade |
| Dominicans | 0.0 /100 | #329 | Tragic 89.4% |
| Immigrants | Yemen | 0.0 /100 | #330 | Tragic 89.1% |
| Mexican American Indians | 0.0 /100 | #331 | Tragic 89.0% |
| Immigrants | Azores | 0.0 /100 | #332 | Tragic 89.0% |
| Hondurans | 0.0 /100 | #333 | Tragic 89.0% |
| Hispanics or Latinos | 0.0 /100 | #334 | Tragic 88.9% |
| Immigrants | Dominican Republic | 0.0 /100 | #335 | Tragic 88.7% |
| Immigrants | Honduras | 0.0 /100 | #336 | Tragic 88.5% |
| Central Americans | 0.0 /100 | #337 | Tragic 88.4% |
| Immigrants | Latin America | 0.0 /100 | #338 | Tragic 88.3% |
| Guatemalans | 0.0 /100 | #339 | Tragic 87.9% |
| Mexicans | 0.0 /100 | #340 | Tragic 87.8% |
| Salvadorans | 0.0 /100 | #341 | Tragic 87.5% |
| Immigrants | Guatemala | 0.0 /100 | #342 | Tragic 87.4% |
| Yakama | 0.0 /100 | #343 | Tragic 86.9% |