Vietnamese vs Immigrants from Honduras Unemployment
COMPARE
Vietnamese
Immigrants from Honduras
Unemployment
Unemployment Comparison
Vietnamese
Immigrants from Honduras
6.5%
UNEMPLOYMENT
0.0/ 100
METRIC RATING
309th/ 347
METRIC RANK
5.7%
UNEMPLOYMENT
0.3/ 100
METRIC RATING
254th/ 347
METRIC RANK
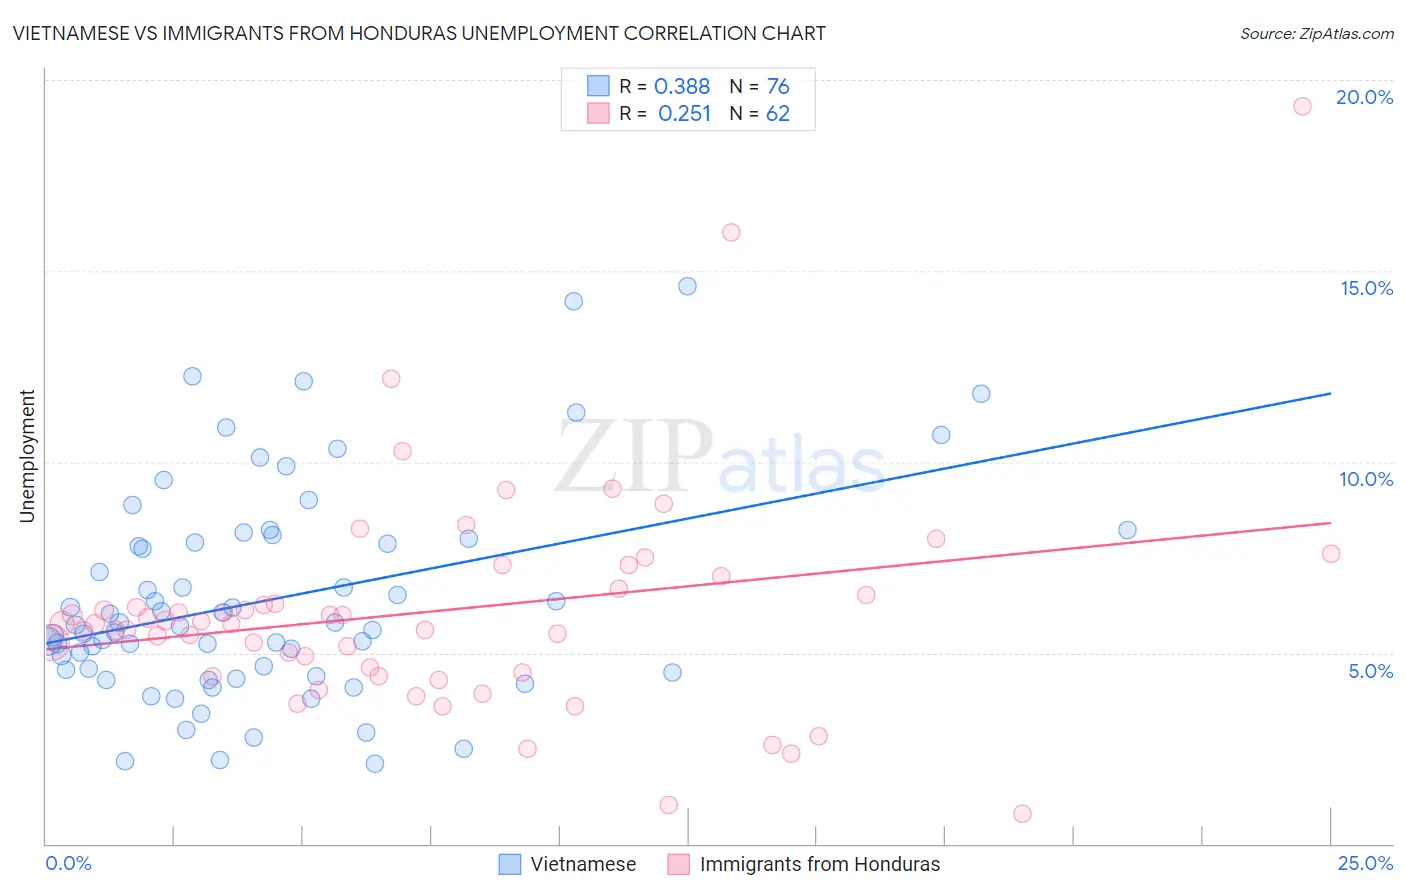
Vietnamese vs Immigrants from Honduras Unemployment Correlation Chart
The statistical analysis conducted on geographies consisting of 170,737,868 people shows a mild positive correlation between the proportion of Vietnamese and unemployment in the United States with a correlation coefficient (R) of 0.388 and weighted average of 6.5%. Similarly, the statistical analysis conducted on geographies consisting of 322,382,212 people shows a weak positive correlation between the proportion of Immigrants from Honduras and unemployment in the United States with a correlation coefficient (R) of 0.251 and weighted average of 5.7%, a difference of 13.5%.
Unemployment Correlation Summary
| Measurement | Vietnamese | Immigrants from Honduras |
| Minimum | 2.1% | 0.80% |
| Maximum | 14.6% | 19.3% |
| Range | 12.5% | 18.5% |
| Mean | 6.4% | 6.1% |
| Median | 5.7% | 5.8% |
| Interquartile 25% (IQ1) | 4.5% | 4.5% |
| Interquartile 75% (IQ3) | 8.0% | 6.7% |
| Interquartile Range (IQR) | 3.4% | 2.2% |
| Standard Deviation (Sample) | 2.8% | 3.0% |
| Standard Deviation (Population) | 2.8% | 2.9% |
Similar Demographics by Unemployment
Demographics Similar to Vietnamese by Unemployment
In terms of unemployment, the demographic groups most similar to Vietnamese are Barbadian (6.5%, a difference of 0.010%), Immigrants from Belize (6.5%, a difference of 0.27%), Immigrants from Bangladesh (6.5%, a difference of 0.38%), Cape Verdean (6.5%, a difference of 0.60%), and Lumbee (6.4%, a difference of 0.87%).
| Demographics | Rating | Rank | Unemployment |
| West Indians | 0.0 /100 | #302 | Tragic 6.4% |
| Belizeans | 0.0 /100 | #303 | Tragic 6.4% |
| Immigrants | Jamaica | 0.0 /100 | #304 | Tragic 6.4% |
| Menominee | 0.0 /100 | #305 | Tragic 6.4% |
| Lumbee | 0.0 /100 | #306 | Tragic 6.4% |
| Immigrants | Bangladesh | 0.0 /100 | #307 | Tragic 6.5% |
| Barbadians | 0.0 /100 | #308 | Tragic 6.5% |
| Vietnamese | 0.0 /100 | #309 | Tragic 6.5% |
| Immigrants | Belize | 0.0 /100 | #310 | Tragic 6.5% |
| Cape Verdeans | 0.0 /100 | #311 | Tragic 6.5% |
| Colville | 0.0 /100 | #312 | Tragic 6.6% |
| Immigrants | Barbados | 0.0 /100 | #313 | Tragic 6.6% |
| Blacks/African Americans | 0.0 /100 | #314 | Tragic 6.6% |
| Houma | 0.0 /100 | #315 | Tragic 6.7% |
| Immigrants | Dominica | 0.0 /100 | #316 | Tragic 6.7% |
Demographics Similar to Immigrants from Honduras by Unemployment
In terms of unemployment, the demographic groups most similar to Immigrants from Honduras are Central American (5.7%, a difference of 0.070%), Honduran (5.7%, a difference of 0.080%), Immigrants from Portugal (5.7%, a difference of 0.44%), Guatemalan (5.8%, a difference of 0.65%), and Kiowa (5.7%, a difference of 0.83%).
| Demographics | Rating | Rank | Unemployment |
| Immigrants | Cameroon | 1.0 /100 | #247 | Tragic 5.6% |
| Liberians | 0.9 /100 | #248 | Tragic 5.6% |
| Cajuns | 0.8 /100 | #249 | Tragic 5.6% |
| Japanese | 0.8 /100 | #250 | Tragic 5.6% |
| Kiowa | 0.6 /100 | #251 | Tragic 5.7% |
| Hondurans | 0.3 /100 | #252 | Tragic 5.7% |
| Central Americans | 0.3 /100 | #253 | Tragic 5.7% |
| Immigrants | Honduras | 0.3 /100 | #254 | Tragic 5.7% |
| Immigrants | Portugal | 0.2 /100 | #255 | Tragic 5.7% |
| Guatemalans | 0.2 /100 | #256 | Tragic 5.8% |
| Yaqui | 0.2 /100 | #257 | Tragic 5.8% |
| Immigrants | Bahamas | 0.1 /100 | #258 | Tragic 5.8% |
| Sub-Saharan Africans | 0.1 /100 | #259 | Tragic 5.8% |
| Immigrants | Uzbekistan | 0.1 /100 | #260 | Tragic 5.8% |
| Immigrants | Guatemala | 0.1 /100 | #261 | Tragic 5.8% |