Immigrants from South America vs Immigrants from Honduras Median Household Income
COMPARE
Immigrants from South America
Immigrants from Honduras
Median Household Income
Median Household Income Comparison
Immigrants from South America
Immigrants from Honduras
$85,611
MEDIAN HOUSEHOLD INCOME
58.1/ 100
METRIC RATING
171st/ 347
METRIC RANK
$71,452
MEDIAN HOUSEHOLD INCOME
0.0/ 100
METRIC RATING
312th/ 347
METRIC RANK
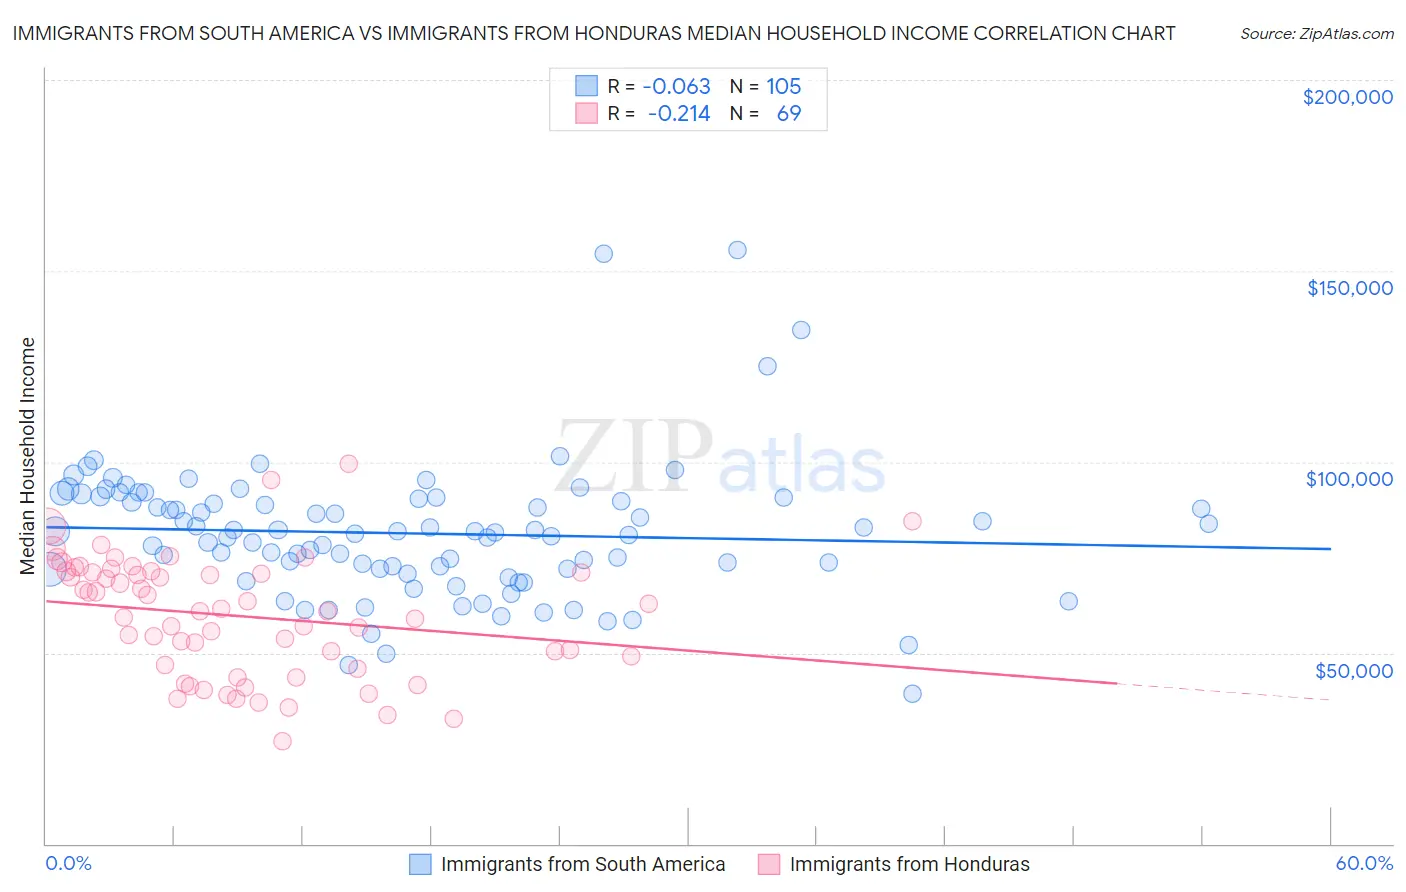
Immigrants from South America vs Immigrants from Honduras Median Household Income Correlation Chart
The statistical analysis conducted on geographies consisting of 485,852,946 people shows a slight negative correlation between the proportion of Immigrants from South America and median household income in the United States with a correlation coefficient (R) of -0.063 and weighted average of $85,611. Similarly, the statistical analysis conducted on geographies consisting of 322,411,098 people shows a weak negative correlation between the proportion of Immigrants from Honduras and median household income in the United States with a correlation coefficient (R) of -0.214 and weighted average of $71,452, a difference of 19.8%.
Median Household Income Correlation Summary
| Measurement | Immigrants from South America | Immigrants from Honduras |
| Minimum | $39,375 | $26,822 |
| Maximum | $155,583 | $99,647 |
| Range | $116,208 | $72,825 |
| Mean | $81,259 | $59,604 |
| Median | $81,529 | $60,896 |
| Interquartile 25% (IQ1) | $71,899 | $46,318 |
| Interquartile 75% (IQ3) | $90,608 | $71,168 |
| Interquartile Range (IQR) | $18,709 | $24,849 |
| Standard Deviation (Sample) | $17,852 | $15,574 |
| Standard Deviation (Population) | $17,766 | $15,460 |
Similar Demographics by Median Household Income
Demographics Similar to Immigrants from South America by Median Household Income
In terms of median household income, the demographic groups most similar to Immigrants from South America are Slovene ($85,562, a difference of 0.060%), Swiss ($85,681, a difference of 0.080%), Colombian ($85,716, a difference of 0.12%), Icelander ($85,797, a difference of 0.22%), and Immigrants ($85,818, a difference of 0.24%).
| Demographics | Rating | Rank | Median Household Income |
| Irish | 66.2 /100 | #164 | Good $86,145 |
| Norwegians | 65.3 /100 | #165 | Good $86,084 |
| Scandinavians | 65.1 /100 | #166 | Good $86,073 |
| Immigrants | Immigrants | 61.3 /100 | #167 | Good $85,818 |
| Icelanders | 61.0 /100 | #168 | Good $85,797 |
| Colombians | 59.7 /100 | #169 | Average $85,716 |
| Swiss | 59.2 /100 | #170 | Average $85,681 |
| Immigrants | South America | 58.1 /100 | #171 | Average $85,611 |
| Slovenes | 57.4 /100 | #172 | Average $85,562 |
| Immigrants | Cameroon | 53.4 /100 | #173 | Average $85,314 |
| Scottish | 50.0 /100 | #174 | Average $85,101 |
| Immigrants | Costa Rica | 49.2 /100 | #175 | Average $85,054 |
| Alsatians | 49.2 /100 | #176 | Average $85,053 |
| Immigrants | Eritrea | 48.8 /100 | #177 | Average $85,025 |
| Czechoslovakians | 47.8 /100 | #178 | Average $84,965 |
Demographics Similar to Immigrants from Honduras by Median Household Income
In terms of median household income, the demographic groups most similar to Immigrants from Honduras are Immigrants from Bahamas ($71,349, a difference of 0.15%), Dominican ($71,302, a difference of 0.21%), Immigrants from Zaire ($71,801, a difference of 0.49%), U.S. Virgin Islander ($71,853, a difference of 0.56%), and Immigrants from Caribbean ($71,860, a difference of 0.57%).
| Demographics | Rating | Rank | Median Household Income |
| Hondurans | 0.0 /100 | #305 | Tragic $72,588 |
| Potawatomi | 0.0 /100 | #306 | Tragic $72,576 |
| Ute | 0.0 /100 | #307 | Tragic $72,402 |
| Yakama | 0.0 /100 | #308 | Tragic $72,225 |
| Immigrants | Caribbean | 0.0 /100 | #309 | Tragic $71,860 |
| U.S. Virgin Islanders | 0.0 /100 | #310 | Tragic $71,853 |
| Immigrants | Zaire | 0.0 /100 | #311 | Tragic $71,801 |
| Immigrants | Honduras | 0.0 /100 | #312 | Tragic $71,452 |
| Immigrants | Bahamas | 0.0 /100 | #313 | Tragic $71,349 |
| Dominicans | 0.0 /100 | #314 | Tragic $71,302 |
| Ottawa | 0.0 /100 | #315 | Tragic $70,984 |
| Apache | 0.0 /100 | #316 | Tragic $70,927 |
| Cajuns | 0.0 /100 | #317 | Tragic $70,605 |
| Chippewa | 0.0 /100 | #318 | Tragic $70,539 |
| Immigrants | Dominican Republic | 0.0 /100 | #319 | Tragic $70,208 |