Romanian vs Immigrants from Honduras Median Household Income
COMPARE
Romanian
Immigrants from Honduras
Median Household Income
Median Household Income Comparison
Romanians
Immigrants from Honduras
$91,994
MEDIAN HOUSEHOLD INCOME
98.8/ 100
METRIC RATING
89th/ 347
METRIC RANK
$71,452
MEDIAN HOUSEHOLD INCOME
0.0/ 100
METRIC RATING
312th/ 347
METRIC RANK
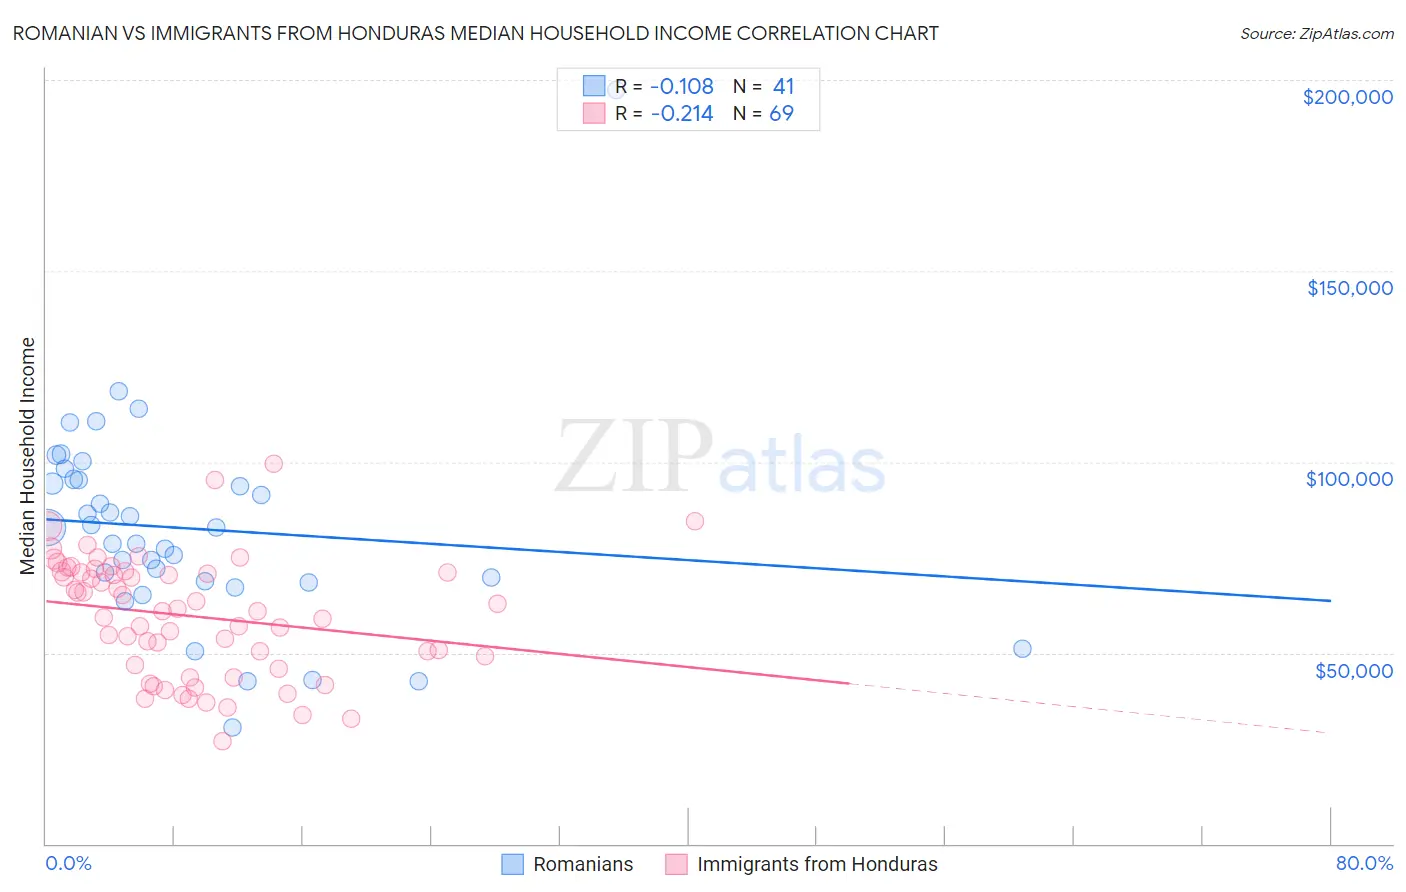
Romanian vs Immigrants from Honduras Median Household Income Correlation Chart
The statistical analysis conducted on geographies consisting of 377,637,037 people shows a poor negative correlation between the proportion of Romanians and median household income in the United States with a correlation coefficient (R) of -0.108 and weighted average of $91,994. Similarly, the statistical analysis conducted on geographies consisting of 322,411,098 people shows a weak negative correlation between the proportion of Immigrants from Honduras and median household income in the United States with a correlation coefficient (R) of -0.214 and weighted average of $71,452, a difference of 28.7%.
Median Household Income Correlation Summary
| Measurement | Romanian | Immigrants from Honduras |
| Minimum | $30,320 | $26,822 |
| Maximum | $197,500 | $99,647 |
| Range | $167,180 | $72,825 |
| Mean | $82,526 | $59,604 |
| Median | $82,785 | $60,896 |
| Interquartile 25% (IQ1) | $68,581 | $46,318 |
| Interquartile 75% (IQ3) | $95,353 | $71,168 |
| Interquartile Range (IQR) | $26,772 | $24,849 |
| Standard Deviation (Sample) | $27,672 | $15,574 |
| Standard Deviation (Population) | $27,332 | $15,460 |
Similar Demographics by Median Household Income
Demographics Similar to Romanians by Median Household Income
In terms of median household income, the demographic groups most similar to Romanians are Assyrian/Chaldean/Syriac ($91,991, a difference of 0.0%), Immigrants from Vietnam ($91,987, a difference of 0.010%), Immigrants from Canada ($92,029, a difference of 0.040%), Immigrants from Western Europe ($91,936, a difference of 0.060%), and Immigrants from England ($92,098, a difference of 0.11%).
| Demographics | Rating | Rank | Median Household Income |
| Immigrants | Spain | 99.3 /100 | #82 | Exceptional $92,732 |
| Italians | 99.1 /100 | #83 | Exceptional $92,475 |
| Immigrants | Argentina | 99.1 /100 | #84 | Exceptional $92,417 |
| Immigrants | Croatia | 99.0 /100 | #85 | Exceptional $92,225 |
| Immigrants | England | 98.9 /100 | #86 | Exceptional $92,098 |
| Immigrants | Hungary | 98.9 /100 | #87 | Exceptional $92,094 |
| Immigrants | Canada | 98.8 /100 | #88 | Exceptional $92,029 |
| Romanians | 98.8 /100 | #89 | Exceptional $91,994 |
| Assyrians/Chaldeans/Syriacs | 98.8 /100 | #90 | Exceptional $91,991 |
| Immigrants | Vietnam | 98.8 /100 | #91 | Exceptional $91,987 |
| Immigrants | Western Europe | 98.8 /100 | #92 | Exceptional $91,936 |
| Immigrants | Lebanon | 98.7 /100 | #93 | Exceptional $91,887 |
| Immigrants | North America | 98.7 /100 | #94 | Exceptional $91,860 |
| Armenians | 98.7 /100 | #95 | Exceptional $91,807 |
| Jordanians | 98.7 /100 | #96 | Exceptional $91,794 |
Demographics Similar to Immigrants from Honduras by Median Household Income
In terms of median household income, the demographic groups most similar to Immigrants from Honduras are Immigrants from Bahamas ($71,349, a difference of 0.15%), Dominican ($71,302, a difference of 0.21%), Immigrants from Zaire ($71,801, a difference of 0.49%), U.S. Virgin Islander ($71,853, a difference of 0.56%), and Immigrants from Caribbean ($71,860, a difference of 0.57%).
| Demographics | Rating | Rank | Median Household Income |
| Hondurans | 0.0 /100 | #305 | Tragic $72,588 |
| Potawatomi | 0.0 /100 | #306 | Tragic $72,576 |
| Ute | 0.0 /100 | #307 | Tragic $72,402 |
| Yakama | 0.0 /100 | #308 | Tragic $72,225 |
| Immigrants | Caribbean | 0.0 /100 | #309 | Tragic $71,860 |
| U.S. Virgin Islanders | 0.0 /100 | #310 | Tragic $71,853 |
| Immigrants | Zaire | 0.0 /100 | #311 | Tragic $71,801 |
| Immigrants | Honduras | 0.0 /100 | #312 | Tragic $71,452 |
| Immigrants | Bahamas | 0.0 /100 | #313 | Tragic $71,349 |
| Dominicans | 0.0 /100 | #314 | Tragic $71,302 |
| Ottawa | 0.0 /100 | #315 | Tragic $70,984 |
| Apache | 0.0 /100 | #316 | Tragic $70,927 |
| Cajuns | 0.0 /100 | #317 | Tragic $70,605 |
| Chippewa | 0.0 /100 | #318 | Tragic $70,539 |
| Immigrants | Dominican Republic | 0.0 /100 | #319 | Tragic $70,208 |