Burmese vs Immigrants from Honduras Median Household Income
COMPARE
Burmese
Immigrants from Honduras
Median Household Income
Median Household Income Comparison
Burmese
Immigrants from Honduras
$103,145
MEDIAN HOUSEHOLD INCOME
100.0/ 100
METRIC RATING
16th/ 347
METRIC RANK
$71,452
MEDIAN HOUSEHOLD INCOME
0.0/ 100
METRIC RATING
312th/ 347
METRIC RANK
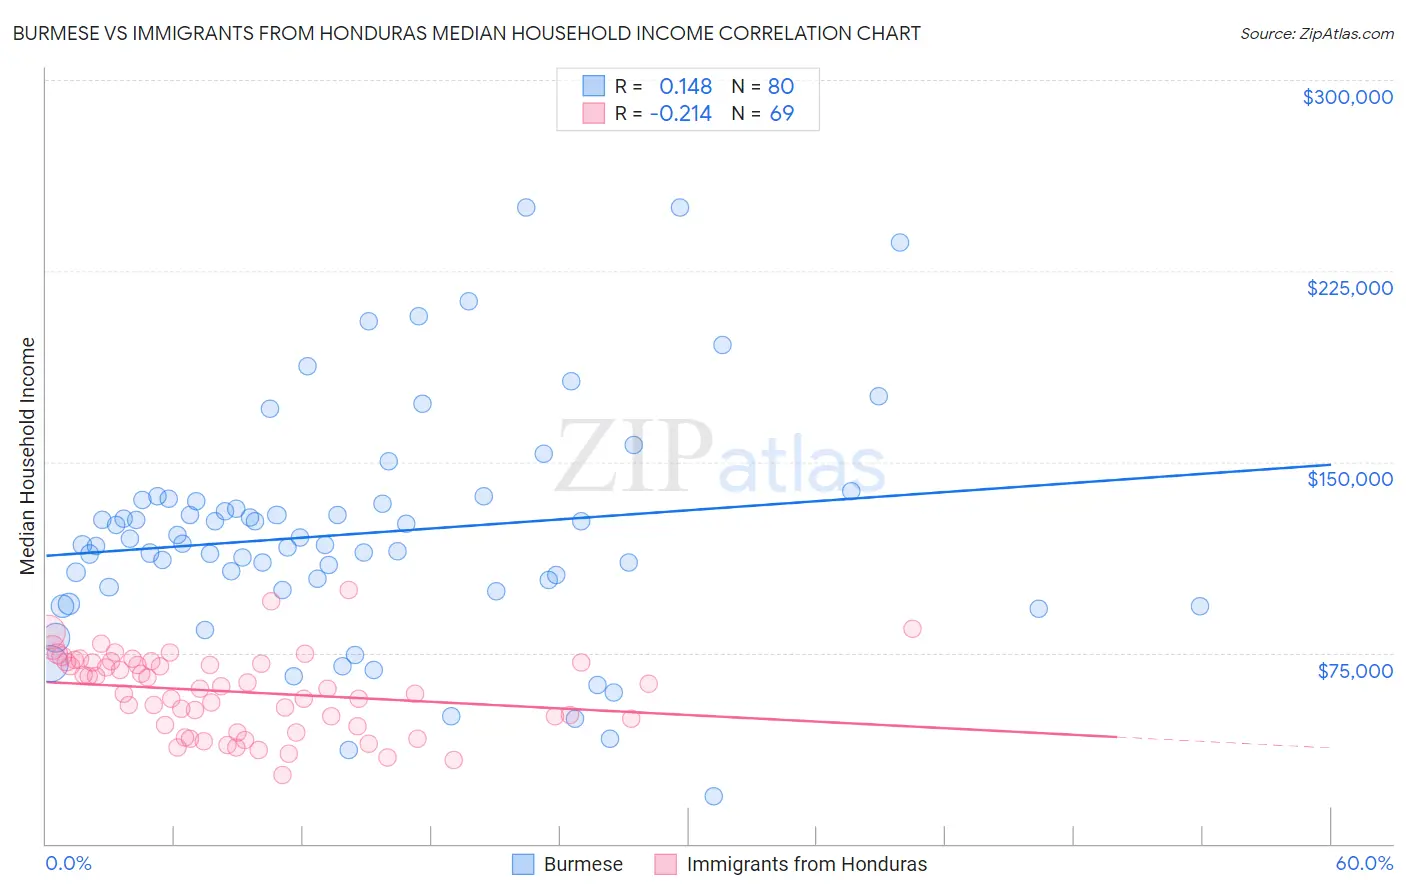
Burmese vs Immigrants from Honduras Median Household Income Correlation Chart
The statistical analysis conducted on geographies consisting of 464,741,598 people shows a poor positive correlation between the proportion of Burmese and median household income in the United States with a correlation coefficient (R) of 0.148 and weighted average of $103,145. Similarly, the statistical analysis conducted on geographies consisting of 322,411,098 people shows a weak negative correlation between the proportion of Immigrants from Honduras and median household income in the United States with a correlation coefficient (R) of -0.214 and weighted average of $71,452, a difference of 44.4%.
Median Household Income Correlation Summary
| Measurement | Burmese | Immigrants from Honduras |
| Minimum | $18,739 | $26,822 |
| Maximum | $250,001 | $99,647 |
| Range | $231,262 | $72,825 |
| Mean | $121,887 | $59,604 |
| Median | $117,660 | $60,896 |
| Interquartile 25% (IQ1) | $100,120 | $46,318 |
| Interquartile 75% (IQ3) | $134,790 | $71,168 |
| Interquartile Range (IQR) | $34,670 | $24,849 |
| Standard Deviation (Sample) | $45,107 | $15,574 |
| Standard Deviation (Population) | $44,824 | $15,460 |
Similar Demographics by Median Household Income
Demographics Similar to Burmese by Median Household Income
In terms of median household income, the demographic groups most similar to Burmese are Immigrants from Korea ($102,962, a difference of 0.18%), Cypriot ($102,843, a difference of 0.29%), Immigrants from Australia ($102,562, a difference of 0.57%), Immigrants from Israel ($104,090, a difference of 0.92%), and Bolivian ($102,195, a difference of 0.93%).
| Demographics | Rating | Rank | Median Household Income |
| Okinawans | 100.0 /100 | #9 | Exceptional $106,624 |
| Immigrants | South Central Asia | 100.0 /100 | #10 | Exceptional $106,057 |
| Immigrants | China | 100.0 /100 | #11 | Exceptional $105,335 |
| Indians (Asian) | 100.0 /100 | #12 | Exceptional $105,262 |
| Immigrants | Eastern Asia | 100.0 /100 | #13 | Exceptional $104,796 |
| Immigrants | Ireland | 100.0 /100 | #14 | Exceptional $104,692 |
| Immigrants | Israel | 100.0 /100 | #15 | Exceptional $104,090 |
| Burmese | 100.0 /100 | #16 | Exceptional $103,145 |
| Immigrants | Korea | 100.0 /100 | #17 | Exceptional $102,962 |
| Cypriots | 100.0 /100 | #18 | Exceptional $102,843 |
| Immigrants | Australia | 100.0 /100 | #19 | Exceptional $102,562 |
| Bolivians | 100.0 /100 | #20 | Exceptional $102,195 |
| Eastern Europeans | 100.0 /100 | #21 | Exceptional $101,781 |
| Asians | 100.0 /100 | #22 | Exceptional $101,681 |
| Immigrants | Bolivia | 100.0 /100 | #23 | Exceptional $101,394 |
Demographics Similar to Immigrants from Honduras by Median Household Income
In terms of median household income, the demographic groups most similar to Immigrants from Honduras are Immigrants from Bahamas ($71,349, a difference of 0.15%), Dominican ($71,302, a difference of 0.21%), Immigrants from Zaire ($71,801, a difference of 0.49%), U.S. Virgin Islander ($71,853, a difference of 0.56%), and Immigrants from Caribbean ($71,860, a difference of 0.57%).
| Demographics | Rating | Rank | Median Household Income |
| Hondurans | 0.0 /100 | #305 | Tragic $72,588 |
| Potawatomi | 0.0 /100 | #306 | Tragic $72,576 |
| Ute | 0.0 /100 | #307 | Tragic $72,402 |
| Yakama | 0.0 /100 | #308 | Tragic $72,225 |
| Immigrants | Caribbean | 0.0 /100 | #309 | Tragic $71,860 |
| U.S. Virgin Islanders | 0.0 /100 | #310 | Tragic $71,853 |
| Immigrants | Zaire | 0.0 /100 | #311 | Tragic $71,801 |
| Immigrants | Honduras | 0.0 /100 | #312 | Tragic $71,452 |
| Immigrants | Bahamas | 0.0 /100 | #313 | Tragic $71,349 |
| Dominicans | 0.0 /100 | #314 | Tragic $71,302 |
| Ottawa | 0.0 /100 | #315 | Tragic $70,984 |
| Apache | 0.0 /100 | #316 | Tragic $70,927 |
| Cajuns | 0.0 /100 | #317 | Tragic $70,605 |
| Chippewa | 0.0 /100 | #318 | Tragic $70,539 |
| Immigrants | Dominican Republic | 0.0 /100 | #319 | Tragic $70,208 |