Turkish vs Immigrants from Zimbabwe Bachelor's Degree
COMPARE
Turkish
Immigrants from Zimbabwe
Bachelor's Degree
Bachelor's Degree Comparison
Turks
Immigrants from Zimbabwe
46.2%
BACHELOR'S DEGREE
100.0/ 100
METRIC RATING
28th/ 347
METRIC RANK
42.6%
BACHELOR'S DEGREE
99.4/ 100
METRIC RATING
75th/ 347
METRIC RANK
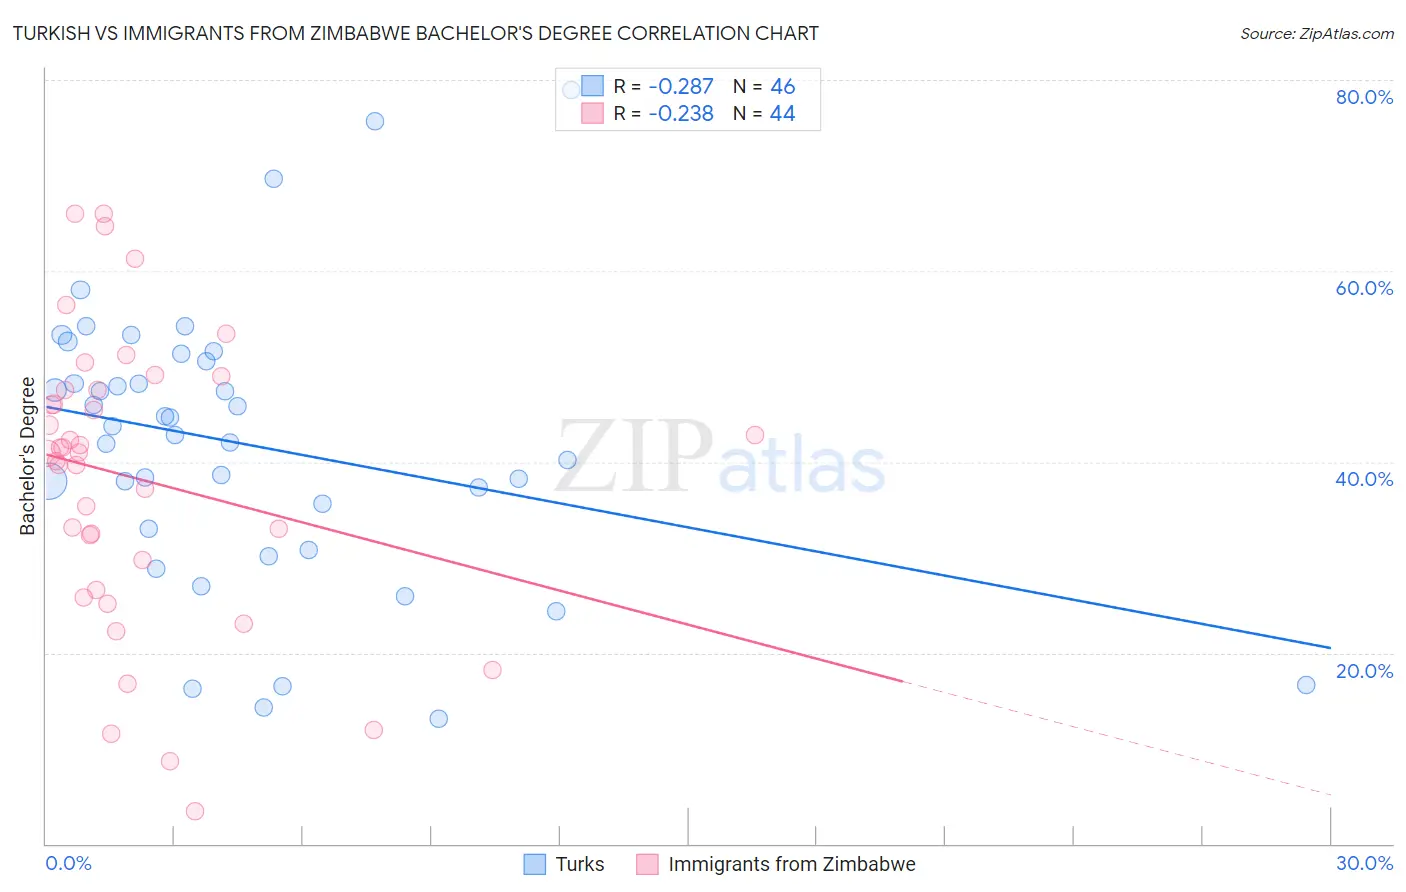
Turkish vs Immigrants from Zimbabwe Bachelor's Degree Correlation Chart
The statistical analysis conducted on geographies consisting of 271,847,696 people shows a weak negative correlation between the proportion of Turks and percentage of population with at least bachelor's degree education in the United States with a correlation coefficient (R) of -0.287 and weighted average of 46.2%. Similarly, the statistical analysis conducted on geographies consisting of 117,809,864 people shows a weak negative correlation between the proportion of Immigrants from Zimbabwe and percentage of population with at least bachelor's degree education in the United States with a correlation coefficient (R) of -0.238 and weighted average of 42.6%, a difference of 8.5%.
Bachelor's Degree Correlation Summary
| Measurement | Turkish | Immigrants from Zimbabwe |
| Minimum | 13.1% | 3.5% |
| Maximum | 78.9% | 66.0% |
| Range | 65.8% | 62.5% |
| Mean | 41.8% | 38.2% |
| Median | 43.3% | 40.9% |
| Interquartile 25% (IQ1) | 33.0% | 28.1% |
| Interquartile 75% (IQ3) | 50.5% | 47.5% |
| Interquartile Range (IQR) | 17.5% | 19.4% |
| Standard Deviation (Sample) | 14.7% | 15.1% |
| Standard Deviation (Population) | 14.5% | 15.0% |
Similar Demographics by Bachelor's Degree
Demographics Similar to Turks by Bachelor's Degree
In terms of bachelor's degree, the demographic groups most similar to Turks are Israeli (46.1%, a difference of 0.13%), Immigrants from Sri Lanka (46.1%, a difference of 0.18%), Latvian (46.1%, a difference of 0.22%), Immigrants from France (46.4%, a difference of 0.46%), and Immigrants from Turkey (46.0%, a difference of 0.52%).
| Demographics | Rating | Rank | Bachelor's Degree |
| Immigrants | Ireland | 100.0 /100 | #21 | Exceptional 47.1% |
| Immigrants | Belgium | 100.0 /100 | #22 | Exceptional 47.0% |
| Immigrants | Sweden | 100.0 /100 | #23 | Exceptional 47.0% |
| Immigrants | Korea | 100.0 /100 | #24 | Exceptional 47.0% |
| Burmese | 100.0 /100 | #25 | Exceptional 46.9% |
| Immigrants | Japan | 100.0 /100 | #26 | Exceptional 46.8% |
| Immigrants | France | 100.0 /100 | #27 | Exceptional 46.4% |
| Turks | 100.0 /100 | #28 | Exceptional 46.2% |
| Israelis | 100.0 /100 | #29 | Exceptional 46.1% |
| Immigrants | Sri Lanka | 100.0 /100 | #30 | Exceptional 46.1% |
| Latvians | 100.0 /100 | #31 | Exceptional 46.1% |
| Immigrants | Turkey | 100.0 /100 | #32 | Exceptional 46.0% |
| Immigrants | Northern Europe | 100.0 /100 | #33 | Exceptional 45.6% |
| Immigrants | Denmark | 100.0 /100 | #34 | Exceptional 45.4% |
| Immigrants | Russia | 100.0 /100 | #35 | Exceptional 45.4% |
Demographics Similar to Immigrants from Zimbabwe by Bachelor's Degree
In terms of bachelor's degree, the demographic groups most similar to Immigrants from Zimbabwe are Immigrants from Egypt (42.6%, a difference of 0.020%), Immigrants from Eastern Europe (42.5%, a difference of 0.20%), Bhutanese (42.7%, a difference of 0.21%), Immigrants from Ethiopia (42.5%, a difference of 0.26%), and Immigrants from Lebanon (42.4%, a difference of 0.42%).
| Demographics | Rating | Rank | Bachelor's Degree |
| Immigrants | Indonesia | 99.7 /100 | #68 | Exceptional 43.3% |
| Immigrants | Pakistan | 99.7 /100 | #69 | Exceptional 43.1% |
| Immigrants | Romania | 99.6 /100 | #70 | Exceptional 42.9% |
| Immigrants | Argentina | 99.6 /100 | #71 | Exceptional 42.8% |
| Ethiopians | 99.5 /100 | #72 | Exceptional 42.8% |
| Immigrants | Uzbekistan | 99.5 /100 | #73 | Exceptional 42.8% |
| Bhutanese | 99.5 /100 | #74 | Exceptional 42.7% |
| Immigrants | Zimbabwe | 99.4 /100 | #75 | Exceptional 42.6% |
| Immigrants | Egypt | 99.4 /100 | #76 | Exceptional 42.6% |
| Immigrants | Eastern Europe | 99.4 /100 | #77 | Exceptional 42.5% |
| Immigrants | Ethiopia | 99.4 /100 | #78 | Exceptional 42.5% |
| Immigrants | Lebanon | 99.3 /100 | #79 | Exceptional 42.4% |
| Immigrants | Croatia | 99.2 /100 | #80 | Exceptional 42.3% |
| Immigrants | Hungary | 99.2 /100 | #81 | Exceptional 42.3% |
| Immigrants | Scotland | 99.2 /100 | #82 | Exceptional 42.3% |