Tsimshian vs Immigrants from Micronesia Median Family Income
COMPARE
Tsimshian
Immigrants from Micronesia
Median Family Income
Median Family Income Comparison
Tsimshian
Immigrants from Micronesia
$101,543
MEDIAN FAMILY INCOME
35.9/ 100
METRIC RATING
182nd/ 347
METRIC RANK
$90,345
MEDIAN FAMILY INCOME
0.2/ 100
METRIC RATING
273rd/ 347
METRIC RANK
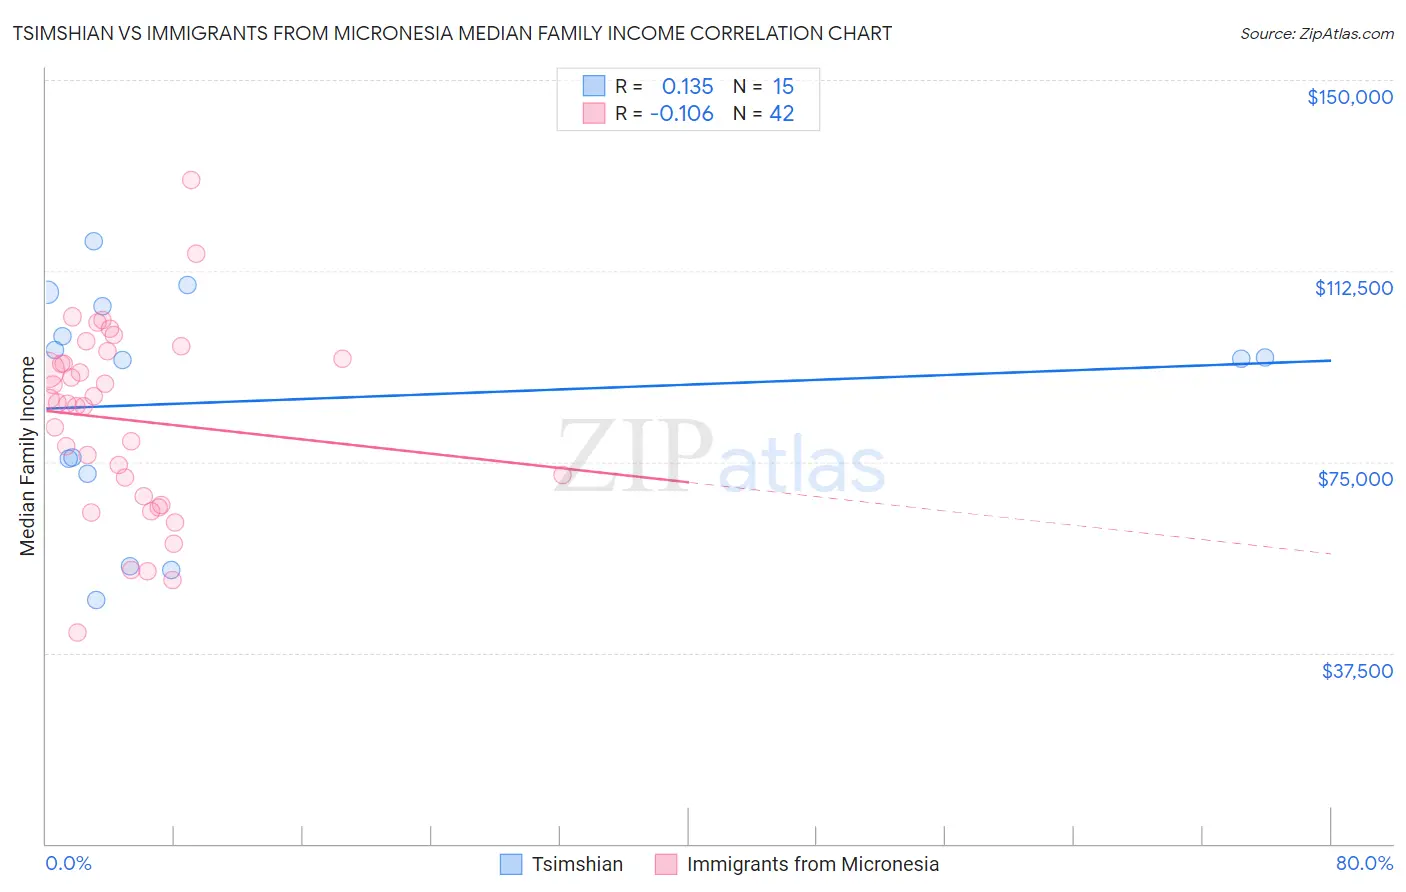
Tsimshian vs Immigrants from Micronesia Median Family Income Correlation Chart
The statistical analysis conducted on geographies consisting of 15,626,544 people shows a poor positive correlation between the proportion of Tsimshian and median family income in the United States with a correlation coefficient (R) of 0.135 and weighted average of $101,543. Similarly, the statistical analysis conducted on geographies consisting of 61,597,595 people shows a poor negative correlation between the proportion of Immigrants from Micronesia and median family income in the United States with a correlation coefficient (R) of -0.106 and weighted average of $90,345, a difference of 12.4%.
Median Family Income Correlation Summary
| Measurement | Tsimshian | Immigrants from Micronesia |
| Minimum | $47,917 | $41,563 |
| Maximum | $118,333 | $130,417 |
| Range | $70,416 | $88,854 |
| Mean | $86,976 | $83,297 |
| Median | $95,278 | $86,500 |
| Interquartile 25% (IQ1) | $72,646 | $68,241 |
| Interquartile 75% (IQ3) | $105,493 | $95,313 |
| Interquartile Range (IQR) | $32,847 | $27,072 |
| Standard Deviation (Sample) | $22,202 | $18,370 |
| Standard Deviation (Population) | $21,449 | $18,150 |
Similar Demographics by Median Family Income
Demographics Similar to Tsimshian by Median Family Income
In terms of median family income, the demographic groups most similar to Tsimshian are Spaniard ($101,617, a difference of 0.070%), French Canadian ($101,634, a difference of 0.090%), Kenyan ($101,417, a difference of 0.12%), Immigrants from Costa Rica ($101,354, a difference of 0.19%), and South American ($101,856, a difference of 0.31%).
| Demographics | Rating | Rank | Median Family Income |
| Immigrants | Eastern Africa | 47.1 /100 | #175 | Average $102,451 |
| French | 46.1 /100 | #176 | Average $102,368 |
| Germans | 44.6 /100 | #177 | Average $102,254 |
| Welsh | 43.3 /100 | #178 | Average $102,151 |
| South Americans | 39.7 /100 | #179 | Fair $101,856 |
| French Canadians | 37.0 /100 | #180 | Fair $101,634 |
| Spaniards | 36.8 /100 | #181 | Fair $101,617 |
| Tsimshian | 35.9 /100 | #182 | Fair $101,543 |
| Kenyans | 34.5 /100 | #183 | Fair $101,417 |
| Immigrants | Costa Rica | 33.7 /100 | #184 | Fair $101,354 |
| Dutch | 31.9 /100 | #185 | Fair $101,192 |
| Celtics | 31.3 /100 | #186 | Fair $101,139 |
| Tlingit-Haida | 30.8 /100 | #187 | Fair $101,092 |
| Guamanians/Chamorros | 30.5 /100 | #188 | Fair $101,061 |
| Immigrants | Portugal | 29.6 /100 | #189 | Fair $100,984 |
Demographics Similar to Immigrants from Micronesia by Median Family Income
In terms of median family income, the demographic groups most similar to Immigrants from Micronesia are Spanish American ($90,322, a difference of 0.020%), Immigrants from Liberia ($90,450, a difference of 0.12%), Iroquois ($90,543, a difference of 0.22%), Jamaican ($90,581, a difference of 0.26%), and Immigrants from St. Vincent and the Grenadines ($90,094, a difference of 0.28%).
| Demographics | Rating | Rank | Median Family Income |
| Central Americans | 0.3 /100 | #266 | Tragic $91,087 |
| Mexican American Indians | 0.2 /100 | #267 | Tragic $90,918 |
| Cree | 0.2 /100 | #268 | Tragic $90,882 |
| Belizeans | 0.2 /100 | #269 | Tragic $90,880 |
| Jamaicans | 0.2 /100 | #270 | Tragic $90,581 |
| Iroquois | 0.2 /100 | #271 | Tragic $90,543 |
| Immigrants | Liberia | 0.2 /100 | #272 | Tragic $90,450 |
| Immigrants | Micronesia | 0.2 /100 | #273 | Tragic $90,345 |
| Spanish Americans | 0.2 /100 | #274 | Tragic $90,322 |
| Immigrants | St. Vincent and the Grenadines | 0.2 /100 | #275 | Tragic $90,094 |
| Immigrants | Zaire | 0.1 /100 | #276 | Tragic $89,285 |
| Immigrants | Jamaica | 0.1 /100 | #277 | Tragic $89,268 |
| Immigrants | Grenada | 0.1 /100 | #278 | Tragic $89,249 |
| Immigrants | Belize | 0.1 /100 | #279 | Tragic $89,197 |
| British West Indians | 0.1 /100 | #280 | Tragic $88,987 |