Cypriot vs Immigrants from Micronesia Median Family Income
COMPARE
Cypriot
Immigrants from Micronesia
Median Family Income
Median Family Income Comparison
Cypriots
Immigrants from Micronesia
$127,064
MEDIAN FAMILY INCOME
100.0/ 100
METRIC RATING
12th/ 347
METRIC RANK
$90,345
MEDIAN FAMILY INCOME
0.2/ 100
METRIC RATING
273rd/ 347
METRIC RANK
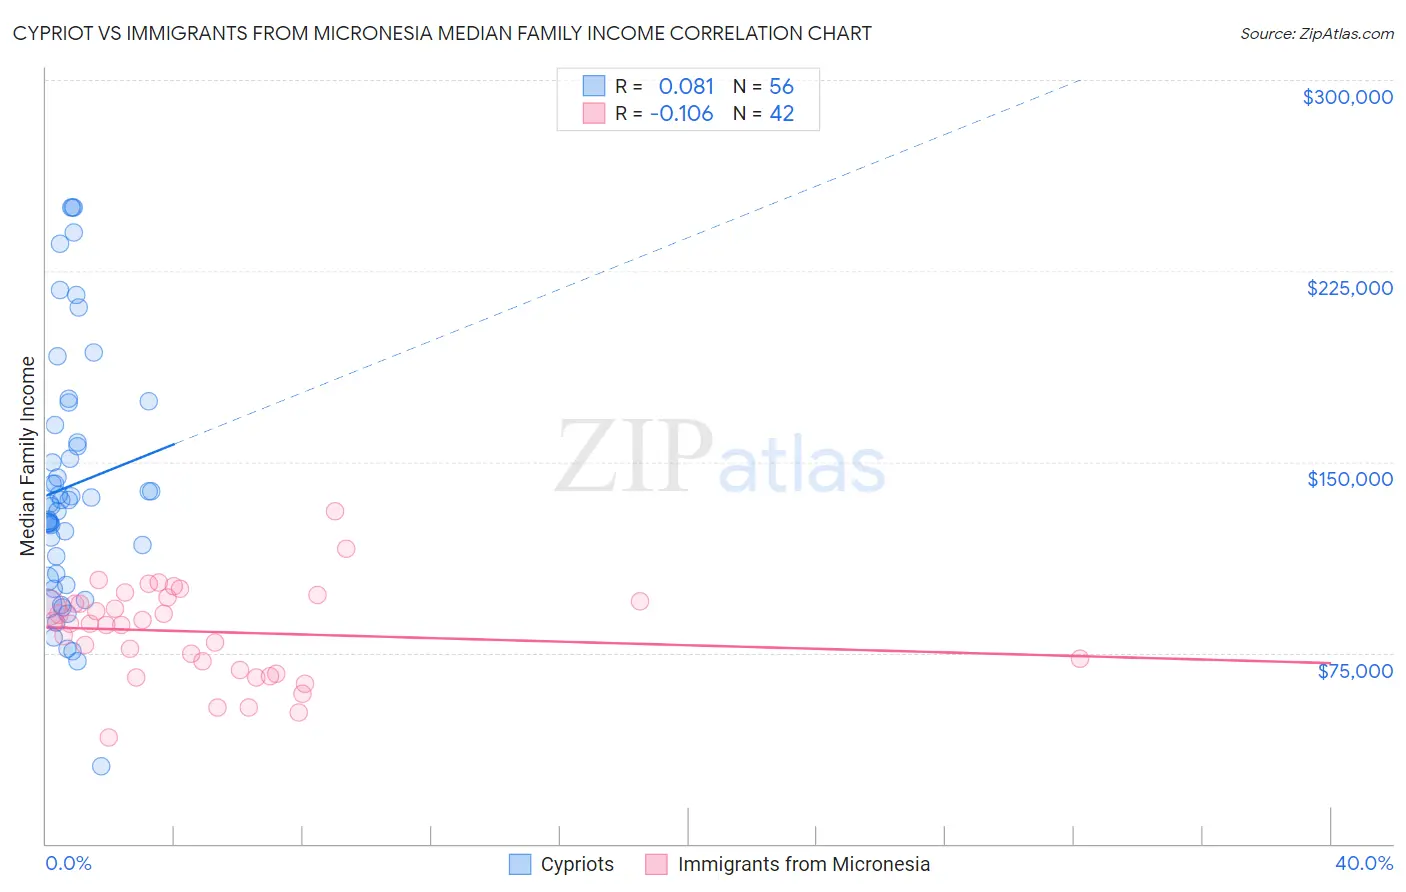
Cypriot vs Immigrants from Micronesia Median Family Income Correlation Chart
The statistical analysis conducted on geographies consisting of 61,838,668 people shows a slight positive correlation between the proportion of Cypriots and median family income in the United States with a correlation coefficient (R) of 0.081 and weighted average of $127,064. Similarly, the statistical analysis conducted on geographies consisting of 61,597,595 people shows a poor negative correlation between the proportion of Immigrants from Micronesia and median family income in the United States with a correlation coefficient (R) of -0.106 and weighted average of $90,345, a difference of 40.6%.
Median Family Income Correlation Summary
| Measurement | Cypriot | Immigrants from Micronesia |
| Minimum | $30,441 | $41,563 |
| Maximum | $250,001 | $130,417 |
| Range | $219,560 | $88,854 |
| Mean | $140,451 | $83,297 |
| Median | $134,246 | $86,500 |
| Interquartile 25% (IQ1) | $104,944 | $68,241 |
| Interquartile 75% (IQ3) | $161,047 | $95,313 |
| Interquartile Range (IQR) | $56,103 | $27,072 |
| Standard Deviation (Sample) | $49,252 | $18,370 |
| Standard Deviation (Population) | $48,811 | $18,150 |
Similar Demographics by Median Family Income
Demographics Similar to Cypriots by Median Family Income
In terms of median family income, the demographic groups most similar to Cypriots are Immigrants from Israel ($127,430, a difference of 0.29%), Immigrants from Australia ($126,620, a difference of 0.35%), Immigrants from Ireland ($127,584, a difference of 0.41%), Immigrants from South Central Asia ($125,956, a difference of 0.88%), and Eastern European ($125,546, a difference of 1.2%).
| Demographics | Rating | Rank | Median Family Income |
| Iranians | 100.0 /100 | #5 | Exceptional $133,839 |
| Thais | 100.0 /100 | #6 | Exceptional $131,281 |
| Immigrants | Hong Kong | 100.0 /100 | #7 | Exceptional $131,067 |
| Immigrants | Iran | 100.0 /100 | #8 | Exceptional $130,894 |
| Okinawans | 100.0 /100 | #9 | Exceptional $129,979 |
| Immigrants | Ireland | 100.0 /100 | #10 | Exceptional $127,584 |
| Immigrants | Israel | 100.0 /100 | #11 | Exceptional $127,430 |
| Cypriots | 100.0 /100 | #12 | Exceptional $127,064 |
| Immigrants | Australia | 100.0 /100 | #13 | Exceptional $126,620 |
| Immigrants | South Central Asia | 100.0 /100 | #14 | Exceptional $125,956 |
| Eastern Europeans | 100.0 /100 | #15 | Exceptional $125,546 |
| Immigrants | China | 100.0 /100 | #16 | Exceptional $125,540 |
| Indians (Asian) | 100.0 /100 | #17 | Exceptional $125,312 |
| Immigrants | Eastern Asia | 100.0 /100 | #18 | Exceptional $125,150 |
| Immigrants | Belgium | 100.0 /100 | #19 | Exceptional $123,831 |
Demographics Similar to Immigrants from Micronesia by Median Family Income
In terms of median family income, the demographic groups most similar to Immigrants from Micronesia are Spanish American ($90,322, a difference of 0.020%), Immigrants from Liberia ($90,450, a difference of 0.12%), Iroquois ($90,543, a difference of 0.22%), Jamaican ($90,581, a difference of 0.26%), and Immigrants from St. Vincent and the Grenadines ($90,094, a difference of 0.28%).
| Demographics | Rating | Rank | Median Family Income |
| Central Americans | 0.3 /100 | #266 | Tragic $91,087 |
| Mexican American Indians | 0.2 /100 | #267 | Tragic $90,918 |
| Cree | 0.2 /100 | #268 | Tragic $90,882 |
| Belizeans | 0.2 /100 | #269 | Tragic $90,880 |
| Jamaicans | 0.2 /100 | #270 | Tragic $90,581 |
| Iroquois | 0.2 /100 | #271 | Tragic $90,543 |
| Immigrants | Liberia | 0.2 /100 | #272 | Tragic $90,450 |
| Immigrants | Micronesia | 0.2 /100 | #273 | Tragic $90,345 |
| Spanish Americans | 0.2 /100 | #274 | Tragic $90,322 |
| Immigrants | St. Vincent and the Grenadines | 0.2 /100 | #275 | Tragic $90,094 |
| Immigrants | Zaire | 0.1 /100 | #276 | Tragic $89,285 |
| Immigrants | Jamaica | 0.1 /100 | #277 | Tragic $89,268 |
| Immigrants | Grenada | 0.1 /100 | #278 | Tragic $89,249 |
| Immigrants | Belize | 0.1 /100 | #279 | Tragic $89,197 |
| British West Indians | 0.1 /100 | #280 | Tragic $88,987 |