Tsimshian vs Immigrants from Micronesia Median Male Earnings
COMPARE
Tsimshian
Immigrants from Micronesia
Median Male Earnings
Median Male Earnings Comparison
Tsimshian
Immigrants from Micronesia
$48,836
MEDIAN MALE EARNINGS
0.4/ 100
METRIC RATING
269th/ 347
METRIC RANK
$47,177
MEDIAN MALE EARNINGS
0.1/ 100
METRIC RATING
298th/ 347
METRIC RANK
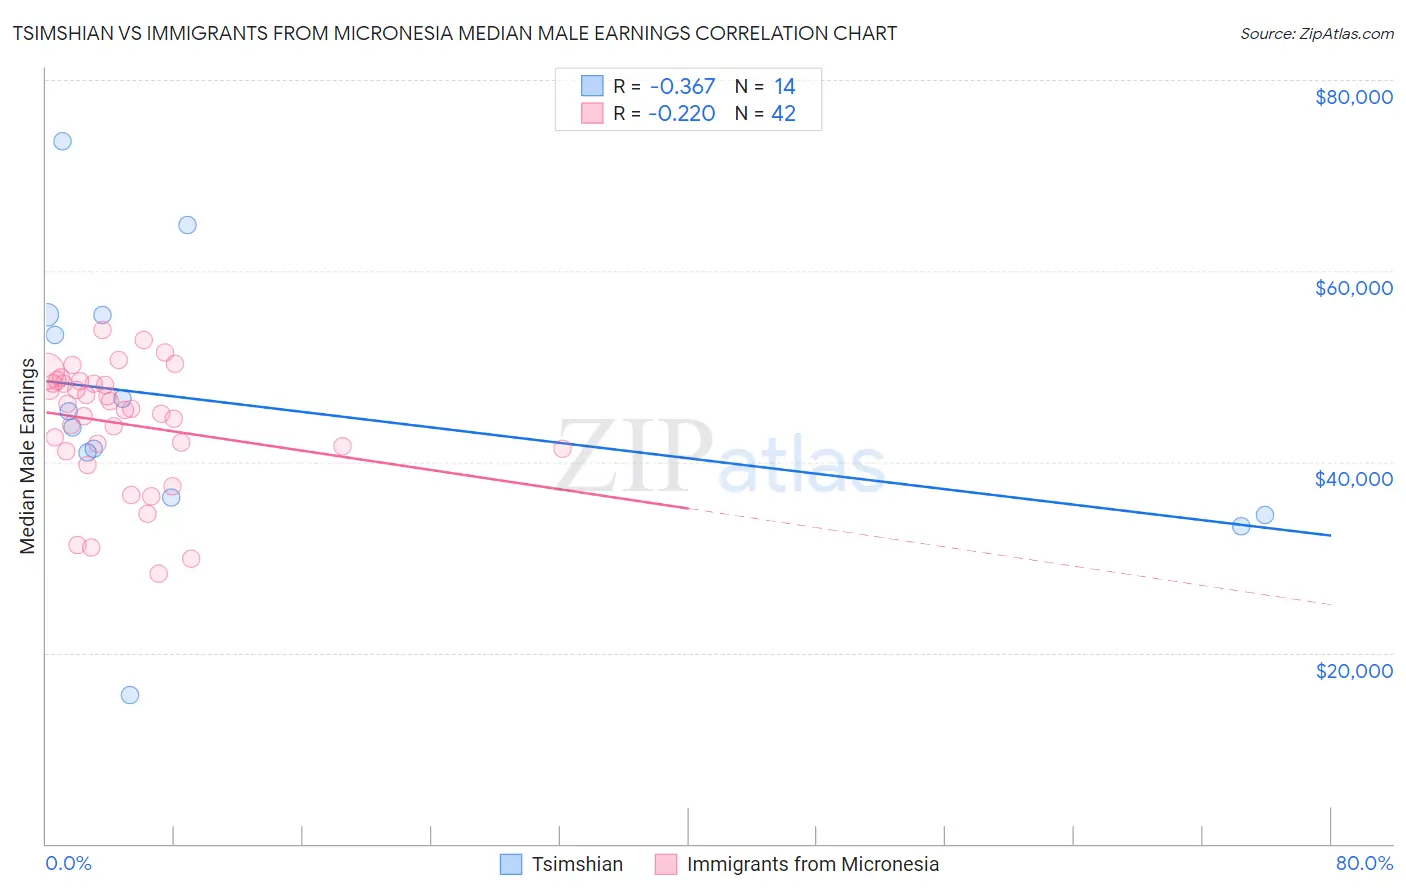
Tsimshian vs Immigrants from Micronesia Median Male Earnings Correlation Chart
The statistical analysis conducted on geographies consisting of 15,625,423 people shows a mild negative correlation between the proportion of Tsimshian and median male earnings in the United States with a correlation coefficient (R) of -0.367 and weighted average of $48,836. Similarly, the statistical analysis conducted on geographies consisting of 61,605,252 people shows a weak negative correlation between the proportion of Immigrants from Micronesia and median male earnings in the United States with a correlation coefficient (R) of -0.220 and weighted average of $47,177, a difference of 3.5%.
Median Male Earnings Correlation Summary
| Measurement | Tsimshian | Immigrants from Micronesia |
| Minimum | $15,625 | $28,299 |
| Maximum | $73,588 | $53,866 |
| Range | $57,963 | $25,567 |
| Mean | $45,710 | $43,968 |
| Median | $44,489 | $45,525 |
| Interquartile 25% (IQ1) | $36,250 | $41,333 |
| Interquartile 75% (IQ3) | $55,386 | $48,203 |
| Interquartile Range (IQR) | $19,136 | $6,870 |
| Standard Deviation (Sample) | $14,437 | $6,332 |
| Standard Deviation (Population) | $13,911 | $6,257 |
Similar Demographics by Median Male Earnings
Demographics Similar to Tsimshian by Median Male Earnings
In terms of median male earnings, the demographic groups most similar to Tsimshian are Ute ($48,899, a difference of 0.13%), Potawatomi ($48,768, a difference of 0.14%), Cherokee ($48,669, a difference of 0.34%), Spanish American ($49,008, a difference of 0.35%), and Somali ($49,025, a difference of 0.39%).
| Demographics | Rating | Rank | Median Male Earnings |
| Immigrants | West Indies | 0.6 /100 | #262 | Tragic $49,271 |
| Nicaraguans | 0.6 /100 | #263 | Tragic $49,215 |
| Immigrants | Middle Africa | 0.6 /100 | #264 | Tragic $49,201 |
| Immigrants | Laos | 0.6 /100 | #265 | Tragic $49,190 |
| Somalis | 0.5 /100 | #266 | Tragic $49,025 |
| Spanish Americans | 0.5 /100 | #267 | Tragic $49,008 |
| Ute | 0.4 /100 | #268 | Tragic $48,899 |
| Tsimshian | 0.4 /100 | #269 | Tragic $48,836 |
| Potawatomi | 0.4 /100 | #270 | Tragic $48,768 |
| Cherokee | 0.3 /100 | #271 | Tragic $48,669 |
| Salvadorans | 0.3 /100 | #272 | Tragic $48,646 |
| Jamaicans | 0.3 /100 | #273 | Tragic $48,632 |
| Colville | 0.3 /100 | #274 | Tragic $48,516 |
| Immigrants | Somalia | 0.3 /100 | #275 | Tragic $48,439 |
| Blackfeet | 0.3 /100 | #276 | Tragic $48,402 |
Demographics Similar to Immigrants from Micronesia by Median Male Earnings
In terms of median male earnings, the demographic groups most similar to Immigrants from Micronesia are Dominican ($47,204, a difference of 0.060%), Inupiat ($47,281, a difference of 0.22%), Immigrants from Zaire ($47,070, a difference of 0.23%), U.S. Virgin Islander ($47,066, a difference of 0.23%), and Immigrants from Latin America ($46,941, a difference of 0.50%).
| Demographics | Rating | Rank | Median Male Earnings |
| Choctaw | 0.1 /100 | #291 | Tragic $47,729 |
| Immigrants | Dominica | 0.1 /100 | #292 | Tragic $47,651 |
| Indonesians | 0.1 /100 | #293 | Tragic $47,503 |
| Immigrants | Nicaragua | 0.1 /100 | #294 | Tragic $47,482 |
| Central American Indians | 0.1 /100 | #295 | Tragic $47,433 |
| Inupiat | 0.1 /100 | #296 | Tragic $47,281 |
| Dominicans | 0.1 /100 | #297 | Tragic $47,204 |
| Immigrants | Micronesia | 0.1 /100 | #298 | Tragic $47,177 |
| Immigrants | Zaire | 0.1 /100 | #299 | Tragic $47,070 |
| U.S. Virgin Islanders | 0.1 /100 | #300 | Tragic $47,066 |
| Immigrants | Latin America | 0.1 /100 | #301 | Tragic $46,941 |
| Seminole | 0.1 /100 | #302 | Tragic $46,783 |
| Yaqui | 0.1 /100 | #303 | Tragic $46,777 |
| Bangladeshis | 0.1 /100 | #304 | Tragic $46,744 |
| Guatemalans | 0.0 /100 | #305 | Tragic $46,736 |