Tsimshian vs Immigrants from Cabo Verde Median Family Income
COMPARE
Tsimshian
Immigrants from Cabo Verde
Median Family Income
Median Family Income Comparison
Tsimshian
Immigrants from Cabo Verde
$101,543
MEDIAN FAMILY INCOME
35.9/ 100
METRIC RATING
182nd/ 347
METRIC RANK
$87,830
MEDIAN FAMILY INCOME
0.1/ 100
METRIC RATING
291st/ 347
METRIC RANK
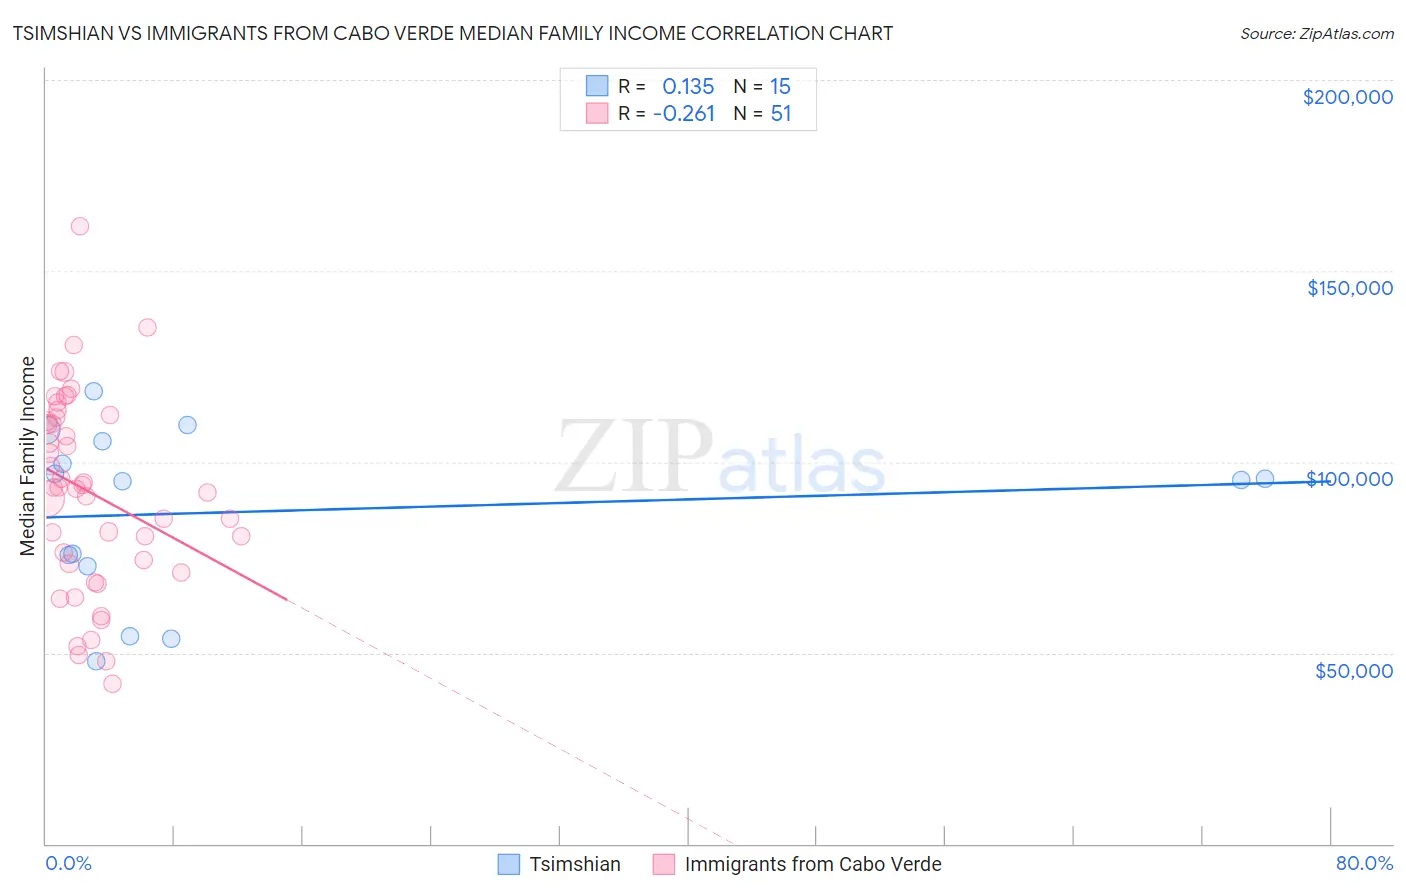
Tsimshian vs Immigrants from Cabo Verde Median Family Income Correlation Chart
The statistical analysis conducted on geographies consisting of 15,626,544 people shows a poor positive correlation between the proportion of Tsimshian and median family income in the United States with a correlation coefficient (R) of 0.135 and weighted average of $101,543. Similarly, the statistical analysis conducted on geographies consisting of 38,130,720 people shows a weak negative correlation between the proportion of Immigrants from Cabo Verde and median family income in the United States with a correlation coefficient (R) of -0.261 and weighted average of $87,830, a difference of 15.6%.
Median Family Income Correlation Summary
| Measurement | Tsimshian | Immigrants from Cabo Verde |
| Minimum | $47,917 | $41,875 |
| Maximum | $118,333 | $161,685 |
| Range | $70,416 | $119,810 |
| Mean | $86,976 | $92,155 |
| Median | $95,278 | $93,152 |
| Interquartile 25% (IQ1) | $72,646 | $73,200 |
| Interquartile 75% (IQ3) | $105,493 | $111,657 |
| Interquartile Range (IQR) | $32,847 | $38,457 |
| Standard Deviation (Sample) | $22,202 | $25,505 |
| Standard Deviation (Population) | $21,449 | $25,254 |
Similar Demographics by Median Family Income
Demographics Similar to Tsimshian by Median Family Income
In terms of median family income, the demographic groups most similar to Tsimshian are Spaniard ($101,617, a difference of 0.070%), French Canadian ($101,634, a difference of 0.090%), Kenyan ($101,417, a difference of 0.12%), Immigrants from Costa Rica ($101,354, a difference of 0.19%), and South American ($101,856, a difference of 0.31%).
| Demographics | Rating | Rank | Median Family Income |
| Immigrants | Eastern Africa | 47.1 /100 | #175 | Average $102,451 |
| French | 46.1 /100 | #176 | Average $102,368 |
| Germans | 44.6 /100 | #177 | Average $102,254 |
| Welsh | 43.3 /100 | #178 | Average $102,151 |
| South Americans | 39.7 /100 | #179 | Fair $101,856 |
| French Canadians | 37.0 /100 | #180 | Fair $101,634 |
| Spaniards | 36.8 /100 | #181 | Fair $101,617 |
| Tsimshian | 35.9 /100 | #182 | Fair $101,543 |
| Kenyans | 34.5 /100 | #183 | Fair $101,417 |
| Immigrants | Costa Rica | 33.7 /100 | #184 | Fair $101,354 |
| Dutch | 31.9 /100 | #185 | Fair $101,192 |
| Celtics | 31.3 /100 | #186 | Fair $101,139 |
| Tlingit-Haida | 30.8 /100 | #187 | Fair $101,092 |
| Guamanians/Chamorros | 30.5 /100 | #188 | Fair $101,061 |
| Immigrants | Portugal | 29.6 /100 | #189 | Fair $100,984 |
Demographics Similar to Immigrants from Cabo Verde by Median Family Income
In terms of median family income, the demographic groups most similar to Immigrants from Cabo Verde are African ($87,820, a difference of 0.010%), Shoshone ($87,872, a difference of 0.050%), Central American Indian ($88,034, a difference of 0.23%), Ute ($87,596, a difference of 0.27%), and Cherokee ($88,209, a difference of 0.43%).
| Demographics | Rating | Rank | Median Family Income |
| Indonesians | 0.1 /100 | #284 | Tragic $88,301 |
| Guatemalans | 0.1 /100 | #285 | Tragic $88,295 |
| Immigrants | Nicaragua | 0.1 /100 | #286 | Tragic $88,267 |
| Potawatomi | 0.1 /100 | #287 | Tragic $88,265 |
| Cherokee | 0.1 /100 | #288 | Tragic $88,209 |
| Central American Indians | 0.1 /100 | #289 | Tragic $88,034 |
| Shoshone | 0.1 /100 | #290 | Tragic $87,872 |
| Immigrants | Cabo Verde | 0.1 /100 | #291 | Tragic $87,830 |
| Africans | 0.1 /100 | #292 | Tragic $87,820 |
| Ute | 0.0 /100 | #293 | Tragic $87,596 |
| Fijians | 0.0 /100 | #294 | Tragic $87,387 |
| Yaqui | 0.0 /100 | #295 | Tragic $87,289 |
| Immigrants | Guatemala | 0.0 /100 | #296 | Tragic $87,191 |
| Cajuns | 0.0 /100 | #297 | Tragic $87,157 |
| Immigrants | Latin America | 0.0 /100 | #298 | Tragic $86,989 |