Houma vs Immigrants from Micronesia Median Family Income
COMPARE
Houma
Immigrants from Micronesia
Median Family Income
Median Family Income Comparison
Houma
Immigrants from Micronesia
$76,188
MEDIAN FAMILY INCOME
0.0/ 100
METRIC RATING
343rd/ 347
METRIC RANK
$90,345
MEDIAN FAMILY INCOME
0.2/ 100
METRIC RATING
273rd/ 347
METRIC RANK
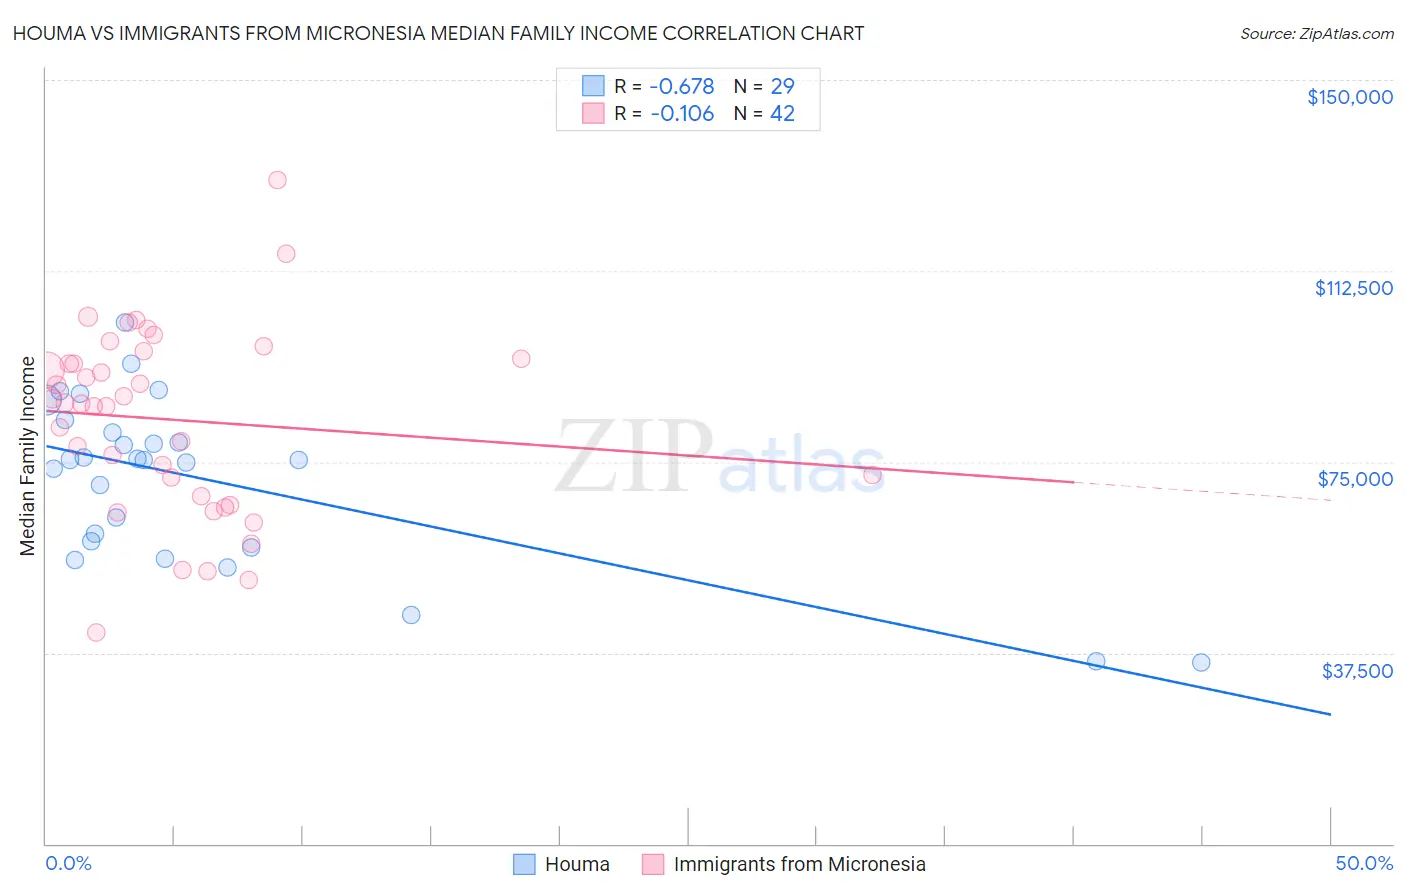
Houma vs Immigrants from Micronesia Median Family Income Correlation Chart
The statistical analysis conducted on geographies consisting of 36,790,797 people shows a significant negative correlation between the proportion of Houma and median family income in the United States with a correlation coefficient (R) of -0.678 and weighted average of $76,188. Similarly, the statistical analysis conducted on geographies consisting of 61,597,595 people shows a poor negative correlation between the proportion of Immigrants from Micronesia and median family income in the United States with a correlation coefficient (R) of -0.106 and weighted average of $90,345, a difference of 18.6%.
Median Family Income Correlation Summary
| Measurement | Houma | Immigrants from Micronesia |
| Minimum | $35,539 | $41,563 |
| Maximum | $102,344 | $130,417 |
| Range | $66,805 | $88,854 |
| Mean | $71,438 | $83,297 |
| Median | $75,379 | $86,500 |
| Interquartile 25% (IQ1) | $58,820 | $68,241 |
| Interquartile 75% (IQ3) | $82,023 | $95,313 |
| Interquartile Range (IQR) | $23,203 | $27,072 |
| Standard Deviation (Sample) | $16,513 | $18,370 |
| Standard Deviation (Population) | $16,226 | $18,150 |
Similar Demographics by Median Family Income
Demographics Similar to Houma by Median Family Income
In terms of median family income, the demographic groups most similar to Houma are Crow ($76,605, a difference of 0.55%), Pueblo ($76,880, a difference of 0.91%), Hopi ($77,188, a difference of 1.3%), Pima ($77,431, a difference of 1.6%), and Immigrants from Yemen ($77,457, a difference of 1.7%).
| Demographics | Rating | Rank | Median Family Income |
| Kiowa | 0.0 /100 | #333 | Tragic $80,885 |
| Menominee | 0.0 /100 | #334 | Tragic $79,563 |
| Yup'ik | 0.0 /100 | #335 | Tragic $79,290 |
| Immigrants | Cuba | 0.0 /100 | #336 | Tragic $78,249 |
| Yuman | 0.0 /100 | #337 | Tragic $78,055 |
| Immigrants | Yemen | 0.0 /100 | #338 | Tragic $77,457 |
| Pima | 0.0 /100 | #339 | Tragic $77,431 |
| Hopi | 0.0 /100 | #340 | Tragic $77,188 |
| Pueblo | 0.0 /100 | #341 | Tragic $76,880 |
| Crow | 0.0 /100 | #342 | Tragic $76,605 |
| Houma | 0.0 /100 | #343 | Tragic $76,188 |
| Tohono O'odham | 0.0 /100 | #344 | Tragic $72,193 |
| Navajo | 0.0 /100 | #345 | Tragic $70,989 |
| Puerto Ricans | 0.0 /100 | #346 | Tragic $70,423 |
| Lumbee | 0.0 /100 | #347 | Tragic $68,679 |
Demographics Similar to Immigrants from Micronesia by Median Family Income
In terms of median family income, the demographic groups most similar to Immigrants from Micronesia are Spanish American ($90,322, a difference of 0.020%), Immigrants from Liberia ($90,450, a difference of 0.12%), Iroquois ($90,543, a difference of 0.22%), Jamaican ($90,581, a difference of 0.26%), and Immigrants from St. Vincent and the Grenadines ($90,094, a difference of 0.28%).
| Demographics | Rating | Rank | Median Family Income |
| Central Americans | 0.3 /100 | #266 | Tragic $91,087 |
| Mexican American Indians | 0.2 /100 | #267 | Tragic $90,918 |
| Cree | 0.2 /100 | #268 | Tragic $90,882 |
| Belizeans | 0.2 /100 | #269 | Tragic $90,880 |
| Jamaicans | 0.2 /100 | #270 | Tragic $90,581 |
| Iroquois | 0.2 /100 | #271 | Tragic $90,543 |
| Immigrants | Liberia | 0.2 /100 | #272 | Tragic $90,450 |
| Immigrants | Micronesia | 0.2 /100 | #273 | Tragic $90,345 |
| Spanish Americans | 0.2 /100 | #274 | Tragic $90,322 |
| Immigrants | St. Vincent and the Grenadines | 0.2 /100 | #275 | Tragic $90,094 |
| Immigrants | Zaire | 0.1 /100 | #276 | Tragic $89,285 |
| Immigrants | Jamaica | 0.1 /100 | #277 | Tragic $89,268 |
| Immigrants | Grenada | 0.1 /100 | #278 | Tragic $89,249 |
| Immigrants | Belize | 0.1 /100 | #279 | Tragic $89,197 |
| British West Indians | 0.1 /100 | #280 | Tragic $88,987 |