Immigrants from Western Africa vs Immigrants from Micronesia Median Family Income
COMPARE
Immigrants from Western Africa
Immigrants from Micronesia
Median Family Income
Median Family Income Comparison
Immigrants from Western Africa
Immigrants from Micronesia
$94,638
MEDIAN FAMILY INCOME
1.6/ 100
METRIC RATING
234th/ 347
METRIC RANK
$90,345
MEDIAN FAMILY INCOME
0.2/ 100
METRIC RATING
273rd/ 347
METRIC RANK
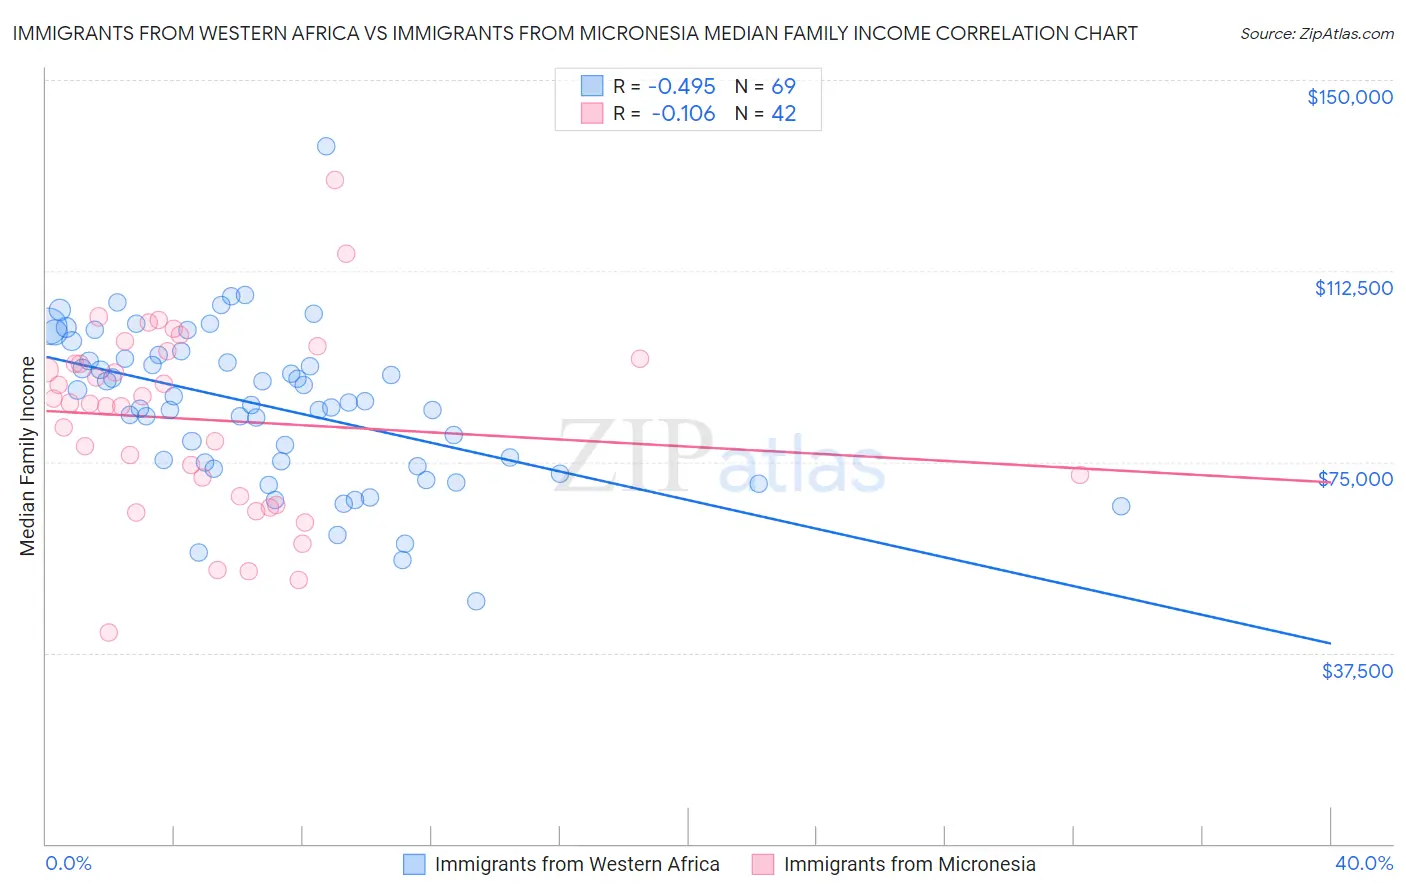
Immigrants from Western Africa vs Immigrants from Micronesia Median Family Income Correlation Chart
The statistical analysis conducted on geographies consisting of 357,410,586 people shows a moderate negative correlation between the proportion of Immigrants from Western Africa and median family income in the United States with a correlation coefficient (R) of -0.495 and weighted average of $94,638. Similarly, the statistical analysis conducted on geographies consisting of 61,597,595 people shows a poor negative correlation between the proportion of Immigrants from Micronesia and median family income in the United States with a correlation coefficient (R) of -0.106 and weighted average of $90,345, a difference of 4.8%.
Median Family Income Correlation Summary
| Measurement | Immigrants from Western Africa | Immigrants from Micronesia |
| Minimum | $47,599 | $41,563 |
| Maximum | $136,923 | $130,417 |
| Range | $89,324 | $88,854 |
| Mean | $85,944 | $83,297 |
| Median | $86,589 | $86,500 |
| Interquartile 25% (IQ1) | $74,581 | $68,241 |
| Interquartile 75% (IQ3) | $95,623 | $95,313 |
| Interquartile Range (IQR) | $21,043 | $27,072 |
| Standard Deviation (Sample) | $15,373 | $18,370 |
| Standard Deviation (Population) | $15,261 | $18,150 |
Similar Demographics by Median Family Income
Demographics Similar to Immigrants from Western Africa by Median Family Income
In terms of median family income, the demographic groups most similar to Immigrants from Western Africa are Immigrants from Bangladesh ($94,665, a difference of 0.030%), Immigrants from Burma/Myanmar ($94,472, a difference of 0.18%), Trinidadian and Tobagonian ($94,466, a difference of 0.18%), Alaskan Athabascan ($94,429, a difference of 0.22%), and Immigrants from Venezuela ($94,904, a difference of 0.28%).
| Demographics | Rating | Rank | Median Family Income |
| Alaska Natives | 2.6 /100 | #227 | Tragic $95,573 |
| Immigrants | Azores | 2.4 /100 | #228 | Tragic $95,402 |
| Marshallese | 2.2 /100 | #229 | Tragic $95,293 |
| Malaysians | 2.2 /100 | #230 | Tragic $95,230 |
| Ecuadorians | 2.1 /100 | #231 | Tragic $95,114 |
| Immigrants | Venezuela | 1.9 /100 | #232 | Tragic $94,904 |
| Immigrants | Bangladesh | 1.6 /100 | #233 | Tragic $94,665 |
| Immigrants | Western Africa | 1.6 /100 | #234 | Tragic $94,638 |
| Immigrants | Burma/Myanmar | 1.5 /100 | #235 | Tragic $94,472 |
| Trinidadians and Tobagonians | 1.5 /100 | #236 | Tragic $94,466 |
| Alaskan Athabascans | 1.5 /100 | #237 | Tragic $94,429 |
| Nepalese | 1.3 /100 | #238 | Tragic $94,153 |
| Salvadorans | 1.2 /100 | #239 | Tragic $94,109 |
| Somalis | 1.2 /100 | #240 | Tragic $94,085 |
| Immigrants | Trinidad and Tobago | 1.2 /100 | #241 | Tragic $93,988 |
Demographics Similar to Immigrants from Micronesia by Median Family Income
In terms of median family income, the demographic groups most similar to Immigrants from Micronesia are Spanish American ($90,322, a difference of 0.020%), Immigrants from Liberia ($90,450, a difference of 0.12%), Iroquois ($90,543, a difference of 0.22%), Jamaican ($90,581, a difference of 0.26%), and Immigrants from St. Vincent and the Grenadines ($90,094, a difference of 0.28%).
| Demographics | Rating | Rank | Median Family Income |
| Central Americans | 0.3 /100 | #266 | Tragic $91,087 |
| Mexican American Indians | 0.2 /100 | #267 | Tragic $90,918 |
| Cree | 0.2 /100 | #268 | Tragic $90,882 |
| Belizeans | 0.2 /100 | #269 | Tragic $90,880 |
| Jamaicans | 0.2 /100 | #270 | Tragic $90,581 |
| Iroquois | 0.2 /100 | #271 | Tragic $90,543 |
| Immigrants | Liberia | 0.2 /100 | #272 | Tragic $90,450 |
| Immigrants | Micronesia | 0.2 /100 | #273 | Tragic $90,345 |
| Spanish Americans | 0.2 /100 | #274 | Tragic $90,322 |
| Immigrants | St. Vincent and the Grenadines | 0.2 /100 | #275 | Tragic $90,094 |
| Immigrants | Zaire | 0.1 /100 | #276 | Tragic $89,285 |
| Immigrants | Jamaica | 0.1 /100 | #277 | Tragic $89,268 |
| Immigrants | Grenada | 0.1 /100 | #278 | Tragic $89,249 |
| Immigrants | Belize | 0.1 /100 | #279 | Tragic $89,197 |
| British West Indians | 0.1 /100 | #280 | Tragic $88,987 |