Tsimshian vs Celtic Median Family Income
COMPARE
Tsimshian
Celtic
Median Family Income
Median Family Income Comparison
Tsimshian
Celtics
$101,543
MEDIAN FAMILY INCOME
35.9/ 100
METRIC RATING
182nd/ 347
METRIC RANK
$101,139
MEDIAN FAMILY INCOME
31.3/ 100
METRIC RATING
186th/ 347
METRIC RANK
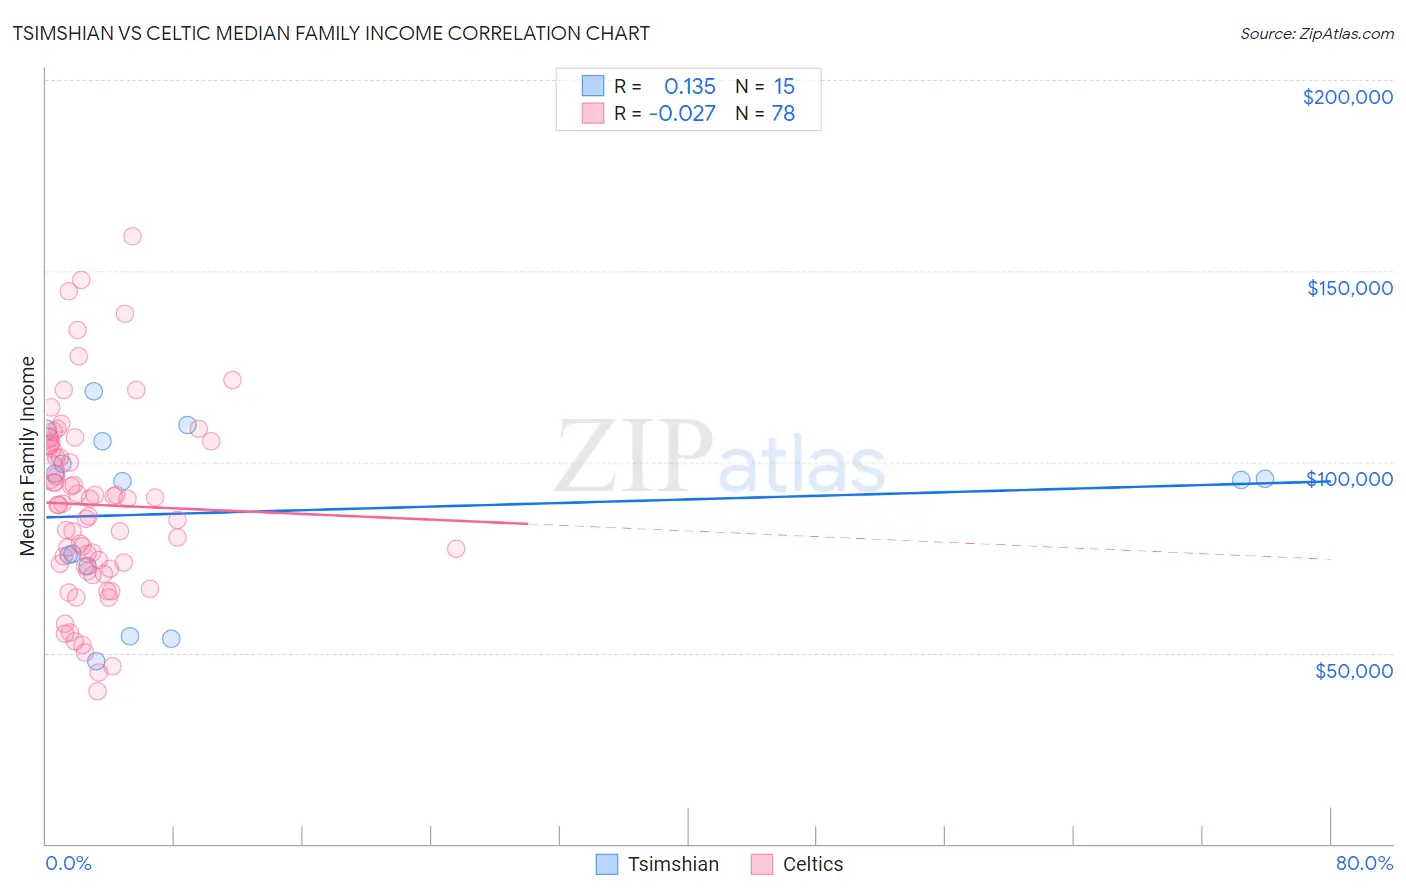
Tsimshian vs Celtic Median Family Income Correlation Chart
The statistical analysis conducted on geographies consisting of 15,626,544 people shows a poor positive correlation between the proportion of Tsimshian and median family income in the United States with a correlation coefficient (R) of 0.135 and weighted average of $101,543. Similarly, the statistical analysis conducted on geographies consisting of 168,835,112 people shows no correlation between the proportion of Celtics and median family income in the United States with a correlation coefficient (R) of -0.027 and weighted average of $101,139, a difference of 0.40%.
Median Family Income Correlation Summary
| Measurement | Tsimshian | Celtic |
| Minimum | $47,917 | $39,850 |
| Maximum | $118,333 | $159,107 |
| Range | $70,416 | $119,257 |
| Mean | $86,976 | $88,779 |
| Median | $95,278 | $88,800 |
| Interquartile 25% (IQ1) | $72,646 | $72,704 |
| Interquartile 75% (IQ3) | $105,493 | $104,459 |
| Interquartile Range (IQR) | $32,847 | $31,755 |
| Standard Deviation (Sample) | $22,202 | $24,372 |
| Standard Deviation (Population) | $21,449 | $24,216 |
Demographics Similar to Tsimshian and Celtics by Median Family Income
In terms of median family income, the demographic groups most similar to Tsimshian are Spaniard ($101,617, a difference of 0.070%), French Canadian ($101,634, a difference of 0.090%), Kenyan ($101,417, a difference of 0.12%), Immigrants from Costa Rica ($101,354, a difference of 0.19%), and South American ($101,856, a difference of 0.31%). Similarly, the demographic groups most similar to Celtics are Dutch ($101,192, a difference of 0.050%), Tlingit-Haida ($101,092, a difference of 0.050%), Guamanian/Chamorro ($101,061, a difference of 0.080%), Immigrants from Portugal ($100,984, a difference of 0.15%), and Immigrants ($100,962, a difference of 0.18%).
| Demographics | Rating | Rank | Median Family Income |
| Finns | 50.0 /100 | #174 | Average $102,676 |
| Immigrants | Eastern Africa | 47.1 /100 | #175 | Average $102,451 |
| French | 46.1 /100 | #176 | Average $102,368 |
| Germans | 44.6 /100 | #177 | Average $102,254 |
| Welsh | 43.3 /100 | #178 | Average $102,151 |
| South Americans | 39.7 /100 | #179 | Fair $101,856 |
| French Canadians | 37.0 /100 | #180 | Fair $101,634 |
| Spaniards | 36.8 /100 | #181 | Fair $101,617 |
| Tsimshian | 35.9 /100 | #182 | Fair $101,543 |
| Kenyans | 34.5 /100 | #183 | Fair $101,417 |
| Immigrants | Costa Rica | 33.7 /100 | #184 | Fair $101,354 |
| Dutch | 31.9 /100 | #185 | Fair $101,192 |
| Celtics | 31.3 /100 | #186 | Fair $101,139 |
| Tlingit-Haida | 30.8 /100 | #187 | Fair $101,092 |
| Guamanians/Chamorros | 30.5 /100 | #188 | Fair $101,061 |
| Immigrants | Portugal | 29.6 /100 | #189 | Fair $100,984 |
| Immigrants | Immigrants | 29.4 /100 | #190 | Fair $100,962 |
| Colombians | 27.2 /100 | #191 | Fair $100,750 |
| Immigrants | Kenya | 26.5 /100 | #192 | Fair $100,679 |
| Iraqis | 26.3 /100 | #193 | Fair $100,658 |
| Uruguayans | 26.3 /100 | #194 | Fair $100,656 |