Marshallese vs Immigrants from Micronesia Median Family Income
COMPARE
Marshallese
Immigrants from Micronesia
Median Family Income
Median Family Income Comparison
Marshallese
Immigrants from Micronesia
$95,293
MEDIAN FAMILY INCOME
2.2/ 100
METRIC RATING
229th/ 347
METRIC RANK
$90,345
MEDIAN FAMILY INCOME
0.2/ 100
METRIC RATING
273rd/ 347
METRIC RANK
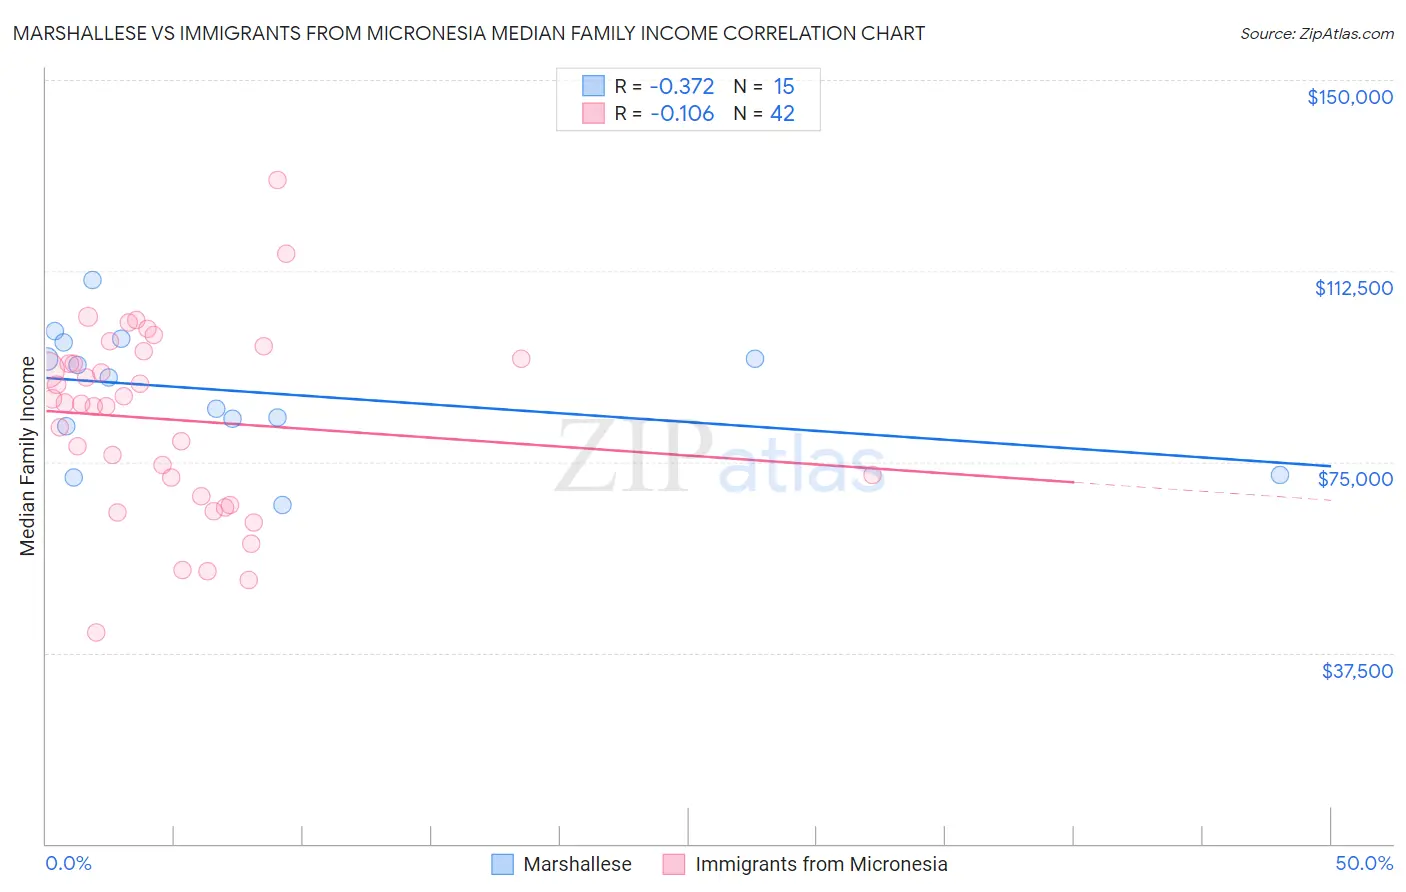
Marshallese vs Immigrants from Micronesia Median Family Income Correlation Chart
The statistical analysis conducted on geographies consisting of 14,760,991 people shows a mild negative correlation between the proportion of Marshallese and median family income in the United States with a correlation coefficient (R) of -0.372 and weighted average of $95,293. Similarly, the statistical analysis conducted on geographies consisting of 61,597,595 people shows a poor negative correlation between the proportion of Immigrants from Micronesia and median family income in the United States with a correlation coefficient (R) of -0.106 and weighted average of $90,345, a difference of 5.5%.
Median Family Income Correlation Summary
| Measurement | Marshallese | Immigrants from Micronesia |
| Minimum | $66,563 | $41,563 |
| Maximum | $110,724 | $130,417 |
| Range | $44,161 | $88,854 |
| Mean | $88,730 | $83,297 |
| Median | $91,530 | $86,500 |
| Interquartile 25% (IQ1) | $81,946 | $68,241 |
| Interquartile 75% (IQ3) | $98,411 | $95,313 |
| Interquartile Range (IQR) | $16,465 | $27,072 |
| Standard Deviation (Sample) | $12,233 | $18,370 |
| Standard Deviation (Population) | $11,818 | $18,150 |
Similar Demographics by Median Family Income
Demographics Similar to Marshallese by Median Family Income
In terms of median family income, the demographic groups most similar to Marshallese are Malaysian ($95,230, a difference of 0.070%), Immigrants from the Azores ($95,402, a difference of 0.11%), Ecuadorian ($95,114, a difference of 0.19%), Alaska Native ($95,573, a difference of 0.29%), and Immigrants from Panama ($95,647, a difference of 0.37%).
| Demographics | Rating | Rank | Median Family Income |
| Immigrants | Nigeria | 4.0 /100 | #222 | Tragic $96,439 |
| Venezuelans | 3.7 /100 | #223 | Tragic $96,281 |
| Immigrants | Nonimmigrants | 3.6 /100 | #224 | Tragic $96,231 |
| Vietnamese | 3.4 /100 | #225 | Tragic $96,123 |
| Immigrants | Panama | 2.7 /100 | #226 | Tragic $95,647 |
| Alaska Natives | 2.6 /100 | #227 | Tragic $95,573 |
| Immigrants | Azores | 2.4 /100 | #228 | Tragic $95,402 |
| Marshallese | 2.2 /100 | #229 | Tragic $95,293 |
| Malaysians | 2.2 /100 | #230 | Tragic $95,230 |
| Ecuadorians | 2.1 /100 | #231 | Tragic $95,114 |
| Immigrants | Venezuela | 1.9 /100 | #232 | Tragic $94,904 |
| Immigrants | Bangladesh | 1.6 /100 | #233 | Tragic $94,665 |
| Immigrants | Western Africa | 1.6 /100 | #234 | Tragic $94,638 |
| Immigrants | Burma/Myanmar | 1.5 /100 | #235 | Tragic $94,472 |
| Trinidadians and Tobagonians | 1.5 /100 | #236 | Tragic $94,466 |
Demographics Similar to Immigrants from Micronesia by Median Family Income
In terms of median family income, the demographic groups most similar to Immigrants from Micronesia are Spanish American ($90,322, a difference of 0.020%), Immigrants from Liberia ($90,450, a difference of 0.12%), Iroquois ($90,543, a difference of 0.22%), Jamaican ($90,581, a difference of 0.26%), and Immigrants from St. Vincent and the Grenadines ($90,094, a difference of 0.28%).
| Demographics | Rating | Rank | Median Family Income |
| Central Americans | 0.3 /100 | #266 | Tragic $91,087 |
| Mexican American Indians | 0.2 /100 | #267 | Tragic $90,918 |
| Cree | 0.2 /100 | #268 | Tragic $90,882 |
| Belizeans | 0.2 /100 | #269 | Tragic $90,880 |
| Jamaicans | 0.2 /100 | #270 | Tragic $90,581 |
| Iroquois | 0.2 /100 | #271 | Tragic $90,543 |
| Immigrants | Liberia | 0.2 /100 | #272 | Tragic $90,450 |
| Immigrants | Micronesia | 0.2 /100 | #273 | Tragic $90,345 |
| Spanish Americans | 0.2 /100 | #274 | Tragic $90,322 |
| Immigrants | St. Vincent and the Grenadines | 0.2 /100 | #275 | Tragic $90,094 |
| Immigrants | Zaire | 0.1 /100 | #276 | Tragic $89,285 |
| Immigrants | Jamaica | 0.1 /100 | #277 | Tragic $89,268 |
| Immigrants | Grenada | 0.1 /100 | #278 | Tragic $89,249 |
| Immigrants | Belize | 0.1 /100 | #279 | Tragic $89,197 |
| British West Indians | 0.1 /100 | #280 | Tragic $88,987 |