Tsimshian vs Immigrants from Micronesia Master's Degree
COMPARE
Tsimshian
Immigrants from Micronesia
Master's Degree
Master's Degree Comparison
Tsimshian
Immigrants from Micronesia
11.4%
MASTER'S DEGREE
0.1/ 100
METRIC RATING
301st/ 347
METRIC RANK
10.8%
MASTER'S DEGREE
0.0/ 100
METRIC RATING
320th/ 347
METRIC RANK
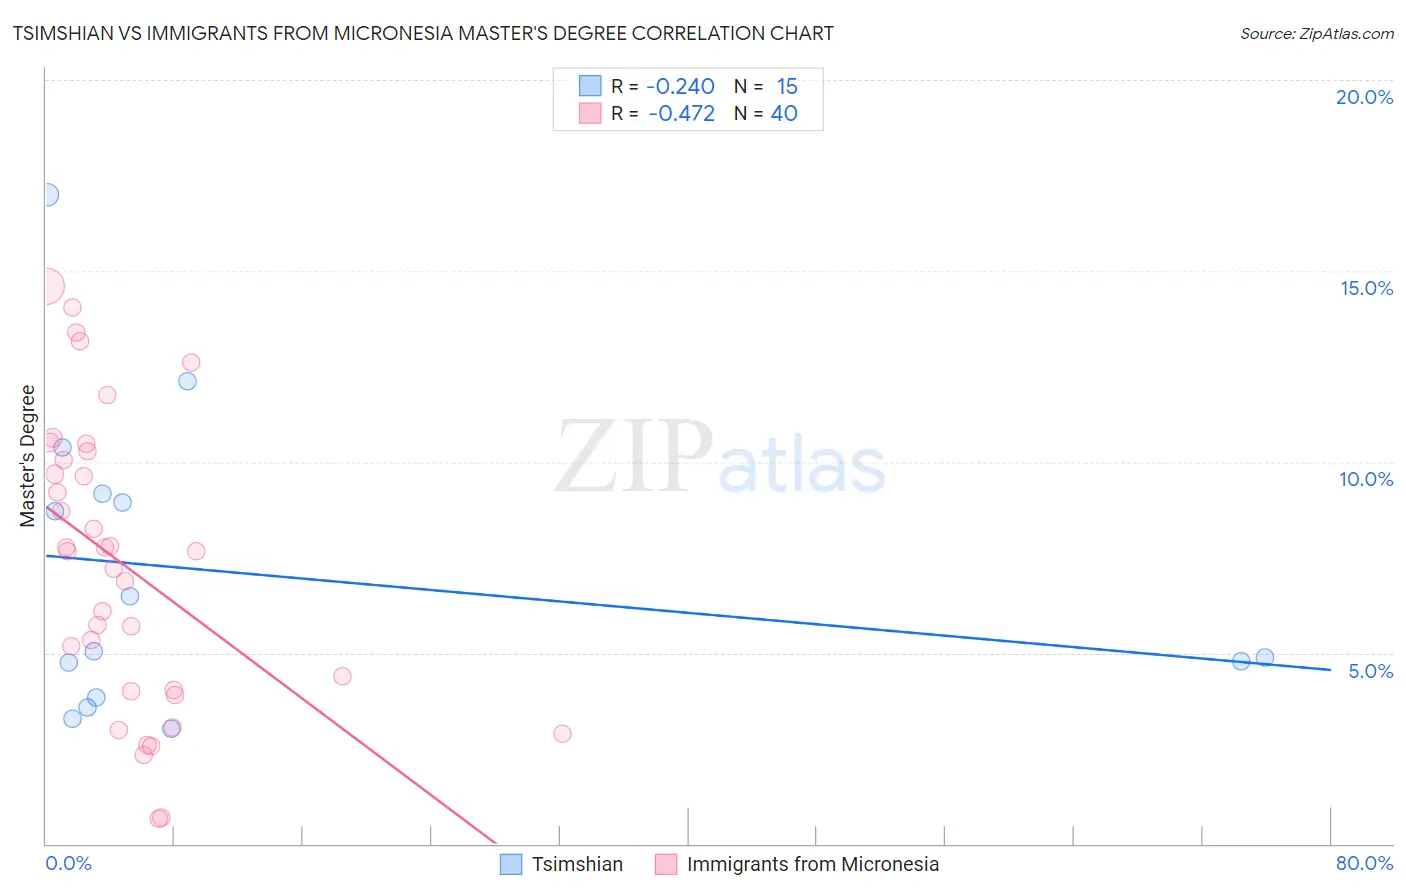
Tsimshian vs Immigrants from Micronesia Master's Degree Correlation Chart
The statistical analysis conducted on geographies consisting of 15,626,544 people shows a weak negative correlation between the proportion of Tsimshian and percentage of population with at least master's degree education in the United States with a correlation coefficient (R) of -0.240 and weighted average of 11.4%. Similarly, the statistical analysis conducted on geographies consisting of 61,602,639 people shows a moderate negative correlation between the proportion of Immigrants from Micronesia and percentage of population with at least master's degree education in the United States with a correlation coefficient (R) of -0.472 and weighted average of 10.8%, a difference of 5.9%.
Master's Degree Correlation Summary
| Measurement | Tsimshian | Immigrants from Micronesia |
| Minimum | 3.0% | 0.67% |
| Maximum | 17.0% | 14.6% |
| Range | 14.0% | 13.9% |
| Mean | 7.1% | 7.3% |
| Median | 5.0% | 7.7% |
| Interquartile 25% (IQ1) | 3.8% | 4.0% |
| Interquartile 75% (IQ3) | 9.2% | 10.2% |
| Interquartile Range (IQR) | 5.3% | 6.1% |
| Standard Deviation (Sample) | 4.0% | 3.8% |
| Standard Deviation (Population) | 3.8% | 3.7% |
Demographics Similar to Tsimshian and Immigrants from Micronesia by Master's Degree
In terms of master's degree, the demographic groups most similar to Tsimshian are Chippewa (11.4%, a difference of 0.16%), Cherokee (11.4%, a difference of 0.31%), Immigrants from Laos (11.4%, a difference of 0.33%), Immigrants from Cabo Verde (11.3%, a difference of 0.52%), and Immigrants from Latin America (11.3%, a difference of 1.2%). Similarly, the demographic groups most similar to Immigrants from Micronesia are Kiowa (10.8%, a difference of 0.62%), Immigrants from Cuba (10.9%, a difference of 0.86%), Hopi (10.9%, a difference of 0.99%), Hispanic or Latino (10.9%, a difference of 1.5%), and Cajun (11.0%, a difference of 1.9%).
| Demographics | Rating | Rank | Master's Degree |
| Chippewa | 0.1 /100 | #300 | Tragic 11.4% |
| Tsimshian | 0.1 /100 | #301 | Tragic 11.4% |
| Cherokee | 0.1 /100 | #302 | Tragic 11.4% |
| Immigrants | Laos | 0.1 /100 | #303 | Tragic 11.4% |
| Immigrants | Cabo Verde | 0.1 /100 | #304 | Tragic 11.3% |
| Immigrants | Latin America | 0.0 /100 | #305 | Tragic 11.3% |
| Mexican American Indians | 0.0 /100 | #306 | Tragic 11.2% |
| Cheyenne | 0.0 /100 | #307 | Tragic 11.2% |
| Puerto Ricans | 0.0 /100 | #308 | Tragic 11.2% |
| Puget Sound Salish | 0.0 /100 | #309 | Tragic 11.1% |
| Shoshone | 0.0 /100 | #310 | Tragic 11.1% |
| Seminole | 0.0 /100 | #311 | Tragic 11.0% |
| Choctaw | 0.0 /100 | #312 | Tragic 11.0% |
| Yaqui | 0.0 /100 | #313 | Tragic 11.0% |
| Cajuns | 0.0 /100 | #314 | Tragic 11.0% |
| Apache | 0.0 /100 | #315 | Tragic 11.0% |
| Hispanics or Latinos | 0.0 /100 | #316 | Tragic 10.9% |
| Hopi | 0.0 /100 | #317 | Tragic 10.9% |
| Immigrants | Cuba | 0.0 /100 | #318 | Tragic 10.9% |
| Kiowa | 0.0 /100 | #319 | Tragic 10.8% |
| Immigrants | Micronesia | 0.0 /100 | #320 | Tragic 10.8% |