Tsimshian vs Immigrants from Colombia Median Family Income
COMPARE
Tsimshian
Immigrants from Colombia
Median Family Income
Median Family Income Comparison
Tsimshian
Immigrants from Colombia
$101,543
MEDIAN FAMILY INCOME
35.9/ 100
METRIC RATING
182nd/ 347
METRIC RANK
$98,067
MEDIAN FAMILY INCOME
8.7/ 100
METRIC RATING
209th/ 347
METRIC RANK
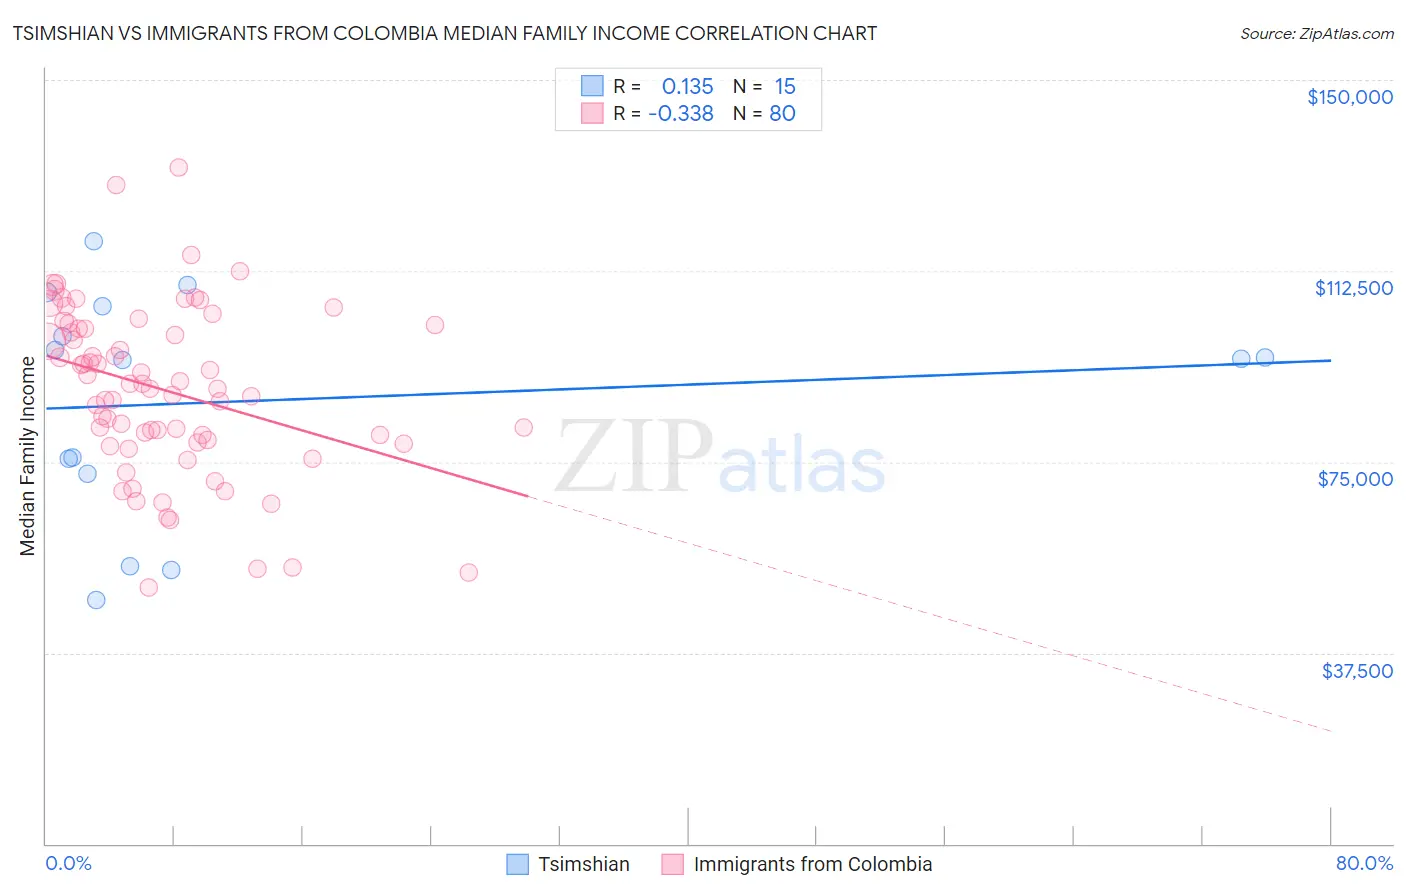
Tsimshian vs Immigrants from Colombia Median Family Income Correlation Chart
The statistical analysis conducted on geographies consisting of 15,626,544 people shows a poor positive correlation between the proportion of Tsimshian and median family income in the United States with a correlation coefficient (R) of 0.135 and weighted average of $101,543. Similarly, the statistical analysis conducted on geographies consisting of 378,430,700 people shows a mild negative correlation between the proportion of Immigrants from Colombia and median family income in the United States with a correlation coefficient (R) of -0.338 and weighted average of $98,067, a difference of 3.5%.
Median Family Income Correlation Summary
| Measurement | Tsimshian | Immigrants from Colombia |
| Minimum | $47,917 | $50,234 |
| Maximum | $118,333 | $132,768 |
| Range | $70,416 | $82,534 |
| Mean | $86,976 | $89,152 |
| Median | $95,278 | $89,834 |
| Interquartile 25% (IQ1) | $72,646 | $78,980 |
| Interquartile 75% (IQ3) | $105,493 | $101,483 |
| Interquartile Range (IQR) | $32,847 | $22,502 |
| Standard Deviation (Sample) | $22,202 | $16,604 |
| Standard Deviation (Population) | $21,449 | $16,499 |
Similar Demographics by Median Family Income
Demographics Similar to Tsimshian by Median Family Income
In terms of median family income, the demographic groups most similar to Tsimshian are Spaniard ($101,617, a difference of 0.070%), French Canadian ($101,634, a difference of 0.090%), Kenyan ($101,417, a difference of 0.12%), Immigrants from Costa Rica ($101,354, a difference of 0.19%), and South American ($101,856, a difference of 0.31%).
| Demographics | Rating | Rank | Median Family Income |
| Immigrants | Eastern Africa | 47.1 /100 | #175 | Average $102,451 |
| French | 46.1 /100 | #176 | Average $102,368 |
| Germans | 44.6 /100 | #177 | Average $102,254 |
| Welsh | 43.3 /100 | #178 | Average $102,151 |
| South Americans | 39.7 /100 | #179 | Fair $101,856 |
| French Canadians | 37.0 /100 | #180 | Fair $101,634 |
| Spaniards | 36.8 /100 | #181 | Fair $101,617 |
| Tsimshian | 35.9 /100 | #182 | Fair $101,543 |
| Kenyans | 34.5 /100 | #183 | Fair $101,417 |
| Immigrants | Costa Rica | 33.7 /100 | #184 | Fair $101,354 |
| Dutch | 31.9 /100 | #185 | Fair $101,192 |
| Celtics | 31.3 /100 | #186 | Fair $101,139 |
| Tlingit-Haida | 30.8 /100 | #187 | Fair $101,092 |
| Guamanians/Chamorros | 30.5 /100 | #188 | Fair $101,061 |
| Immigrants | Portugal | 29.6 /100 | #189 | Fair $100,984 |
Demographics Similar to Immigrants from Colombia by Median Family Income
In terms of median family income, the demographic groups most similar to Immigrants from Colombia are Puget Sound Salish ($97,958, a difference of 0.11%), Immigrants from Uruguay ($98,205, a difference of 0.14%), Immigrants from Sudan ($97,737, a difference of 0.34%), Panamanian ($97,683, a difference of 0.39%), and Immigrants from Armenia ($97,605, a difference of 0.47%).
| Demographics | Rating | Rank | Median Family Income |
| Whites/Caucasians | 18.7 /100 | #202 | Poor $99,800 |
| Scotch-Irish | 17.1 /100 | #203 | Poor $99,591 |
| Ghanaians | 12.6 /100 | #204 | Poor $98,877 |
| Hawaiians | 12.5 /100 | #205 | Poor $98,869 |
| Immigrants | Iraq | 12.1 /100 | #206 | Poor $98,786 |
| Aleuts | 11.6 /100 | #207 | Poor $98,702 |
| Immigrants | Uruguay | 9.2 /100 | #208 | Tragic $98,205 |
| Immigrants | Colombia | 8.7 /100 | #209 | Tragic $98,067 |
| Puget Sound Salish | 8.2 /100 | #210 | Tragic $97,958 |
| Immigrants | Sudan | 7.4 /100 | #211 | Tragic $97,737 |
| Panamanians | 7.2 /100 | #212 | Tragic $97,683 |
| Immigrants | Armenia | 7.0 /100 | #213 | Tragic $97,605 |
| Bermudans | 6.9 /100 | #214 | Tragic $97,577 |
| Nigerians | 6.7 /100 | #215 | Tragic $97,522 |
| Immigrants | Bosnia and Herzegovina | 6.4 /100 | #216 | Tragic $97,432 |